Introduction to Computational Media
Instructor: Lauren McCarthy
12/3/15
Update: revisited code to use button push instead of slider and fixed audio overlap.
Star Builder is a 3D interactive educational simulation of planet, and star formation. The project exists as a P5 sketch with input via a wireless handheld gyroscopic globe controller or via mouse movement. A voice over prompts the user to add mass to an empty point of interstellar space by moving a slider (DOM, or physical potentiometer slider). The narration describes the subsequent transformations from asteroid, to Earth like planet, to gas giant, to star, through the major stellar classifications to blue supergiant. At any point the user may orbit the planet/star object in 3D space via controller ball or mouse drag.
Improvements made from the earlier iterations are animated textures, interactive orbit control, 360 degree texture mapped environment, and voiced narration. During user testing I realized that I was doing a lot of explaining; why not let the code do the work of explaining the visuals? I think that this project would find a home in a museum display, or on a learning website.
// Star Builder source code
var serial; // variable to hold an instance of the serialport library
var portName = ‘/dev/cu.Q_BLUE-DevB’; // fill in your serial port name here
var earth
var gas
var brownd
var redd
var yellowd
var whited
var blued
var space
var taxisY
var taxisZ
var taxisX
var raxisY = 0;
var raxisZ = 0;
var raxisX = 0;
var img
var stars
var x = 0;
var y = 0;
var z = 0;
var soft = 0.04
var playEarth = true
var playGas = true
var playM = true
var playG = true
var playK = true
var playF = true
var playO = true
function preload() {
// loads all images, sounds, and video files)
earth = loadImage(“assets/earth3.jpg”);
dplanet = loadImage(“assets/dplanet.jpg”)
gas = loadImage(“assets/gas.png”);
redd = createVideo(“assets/redd.mp4”);
redd.loop();
redd.hide();
oranged = createVideo(“assets/oranged.mp4”);
oranged.loop();
oranged.hide();
yellowd = createVideo(“assets/yellowd.mp4”);
yellowd.loop();
yellowd.hide();
whited = createVideo(“assets/whited.mp4”);
whited.loop();
whited.hide();
blued = createVideo(“assets/blued.mp4”);
blued.loop();
blued.hide();
space = loadImage(“assets/space2.jpg”);
classStart = loadSound(‘assets/start.mp3’)
classEarth = loadSound(‘assets/earth.mp3’)
classGas = loadSound(‘assets/gas.mp3’)
classM = loadSound(‘assets/red.mp3’)
classG = loadSound(‘assets/orange.mp3’)
classK = loadSound(‘assets/yellow.mp3’)
classF = loadSound(‘assets/white.mp3’)
classO = loadSound(‘assets/blue.mp3’)
}
function setup() {
canvas = createCanvas(windowWidth, windowHeight, WEBGL);
frameRate(24);
classStart.play();
dSlider = createSlider(1, 300, 1);
dSlider.position(20, 20)
serial = new p5.SerialPort(); // make a new instance of the serialport library
serial.on(‘list’, printList); // set a callback function for the serialport list event
serial.on(‘connected’, serverConnected); // callback for connecting to the server
serial.on(‘open’, portOpen); // callback for the port opening
serial.on(‘data’, serialEvent); // callback for when new data arrives
serial.on(‘error’, serialError); // callback for errors
serial.on(‘close’, portClose); // callback for the port closing
serial.list(); // list the serial ports
serial.open(portName); // open a serial port
}
function draw() {
orbitControl();
push();
texture(space);
x += (raxisX – x) * soft;
y += (raxisY – y) * soft;
z += (raxisZ – z) * soft;
rotateX(x);
rotateY(-z);
rotateZ(y);
sphere(2000, 50)
pop();
push();
if (dSlider.value() <= 10) {
texture(dplanet);
}
if (dSlider.value() > 10 && dSlider.value() <= 20) {
texture(earth);
}
if (dSlider.value() > 10 && dSlider.value() <= 20) {
if (classEarth.isPlaying() == false && playEarth == true) {
classEarth.play()
if (classEarth.isPlaying() == true) {
playEarth = false
}
}
}
if (dSlider.value() > 20 && dSlider.value() <= 50) {
texture(gas);
}
if (dSlider.value() > 20 && dSlider.value() <= 50) {
if (classEarth.isPlaying() == false && playGas == true) {
classGas.play()
if (classGas.isPlaying() == true) {
playGas = false
}
}
}
if (dSlider.value() > 50 && dSlider.value() <= 75) {
texture(redd);
}
if (dSlider.value() > 50 && dSlider.value() <= 75) {
if (classM.isPlaying() == false && playM == true) {
classM.play()
if (classM.isPlaying() == true) {
playM = false
}
}
}
if (dSlider.value() > 75 && dSlider.value() <= 100) {
texture(oranged);
}
if (dSlider.value() > 75 && dSlider.value() <= 100) {
if (classG.isPlaying() == false && playG == true) {
classG.play()
if (classG.isPlaying() == true) {
playG = false
}
}
}
if (dSlider.value() > 100 && dSlider.value() <= 150) {
texture(yellowd);
}
if (dSlider.value() > 100 && dSlider.value() <= 150) {
if (classK.isPlaying() == false && playK == true) {
classK.play()
if (classK.isPlaying() == true) {
playK = false
}
}
}
if (dSlider.value() > 150 && dSlider.value() <= 200) {
texture(whited);
}
if (dSlider.value() > 150 && dSlider.value() <= 200) {
if (classF.isPlaying() == false && playF == true) {
classF.play()
if (classF.isPlaying() == true) {
playF = false
}
}
}
if (dSlider.value() > 200) {
texture(blued);
}
if (dSlider.value() > 200) {
if (classO.isPlaying() == false && playO == true) {
classO.play()
if (classO.isPlaying() == true) {
playO = false
}
}
}
x += (raxisX – x) * soft;
y += (raxisY – y) * soft;
z += (raxisZ – z) * soft;
rotateX(x);
rotateY(-z);
rotateZ(y);
// translate(taxisX * 50,taxisY * 50, taxisZ * 50);
sphere(dSlider.value(), 60)
pop();
}
// get the list of ports:
function printList(portList) {
// portList is an array of serial port names
for (var i = 0; i < portList.length; i++) {
// Display the list the console:
println(i + ” ” + portList[i]);
}
}
function serverConnected() {
println(‘connected to server.’);
}
function portOpen() {
println(‘the serial port opened.’)
}
function serialError(err) {
println(‘Something went wrong with the serial port. ‘ + err);
}
function portClose() {
println(‘The serial port closed.’);
}
function serialEvent() {
// read a string from the serial port
// until you get carriage return and newline:
var inString = serial.readStringUntil(‘\r\n’);
//check to see that there’s actually a string there, take accelerometer data and map to degrees:
if (inString.length > 0) {
var sensors = split(inString, ‘,’); // split the string on the commas
if (sensors.length > 5) { // if there are five elements
taxisX = map(sensors[0], -8000, 8000, 0, TWO_PI); // element 0 is taxisX
taxisY = map(sensors[1], -8000, 8000, 0, TWO_PI); // element 1 is taxisY
taxisZ = map(sensors[2], -8000, 8000, 0, TWO_PI); // element 2 is taxisZ
raxisX = map(sensors[3], -8000, 8000, 0, TWO_PI); // element 0 is raxisX
raxisY = map(sensors[4], -8000, 8000, 0, TWO_PI); // element 1 is raxisY
raxisZ = map(sensors[5], -8000, 8000, 0, TWO_PI); // element 2 is raxisZ
}
}
}
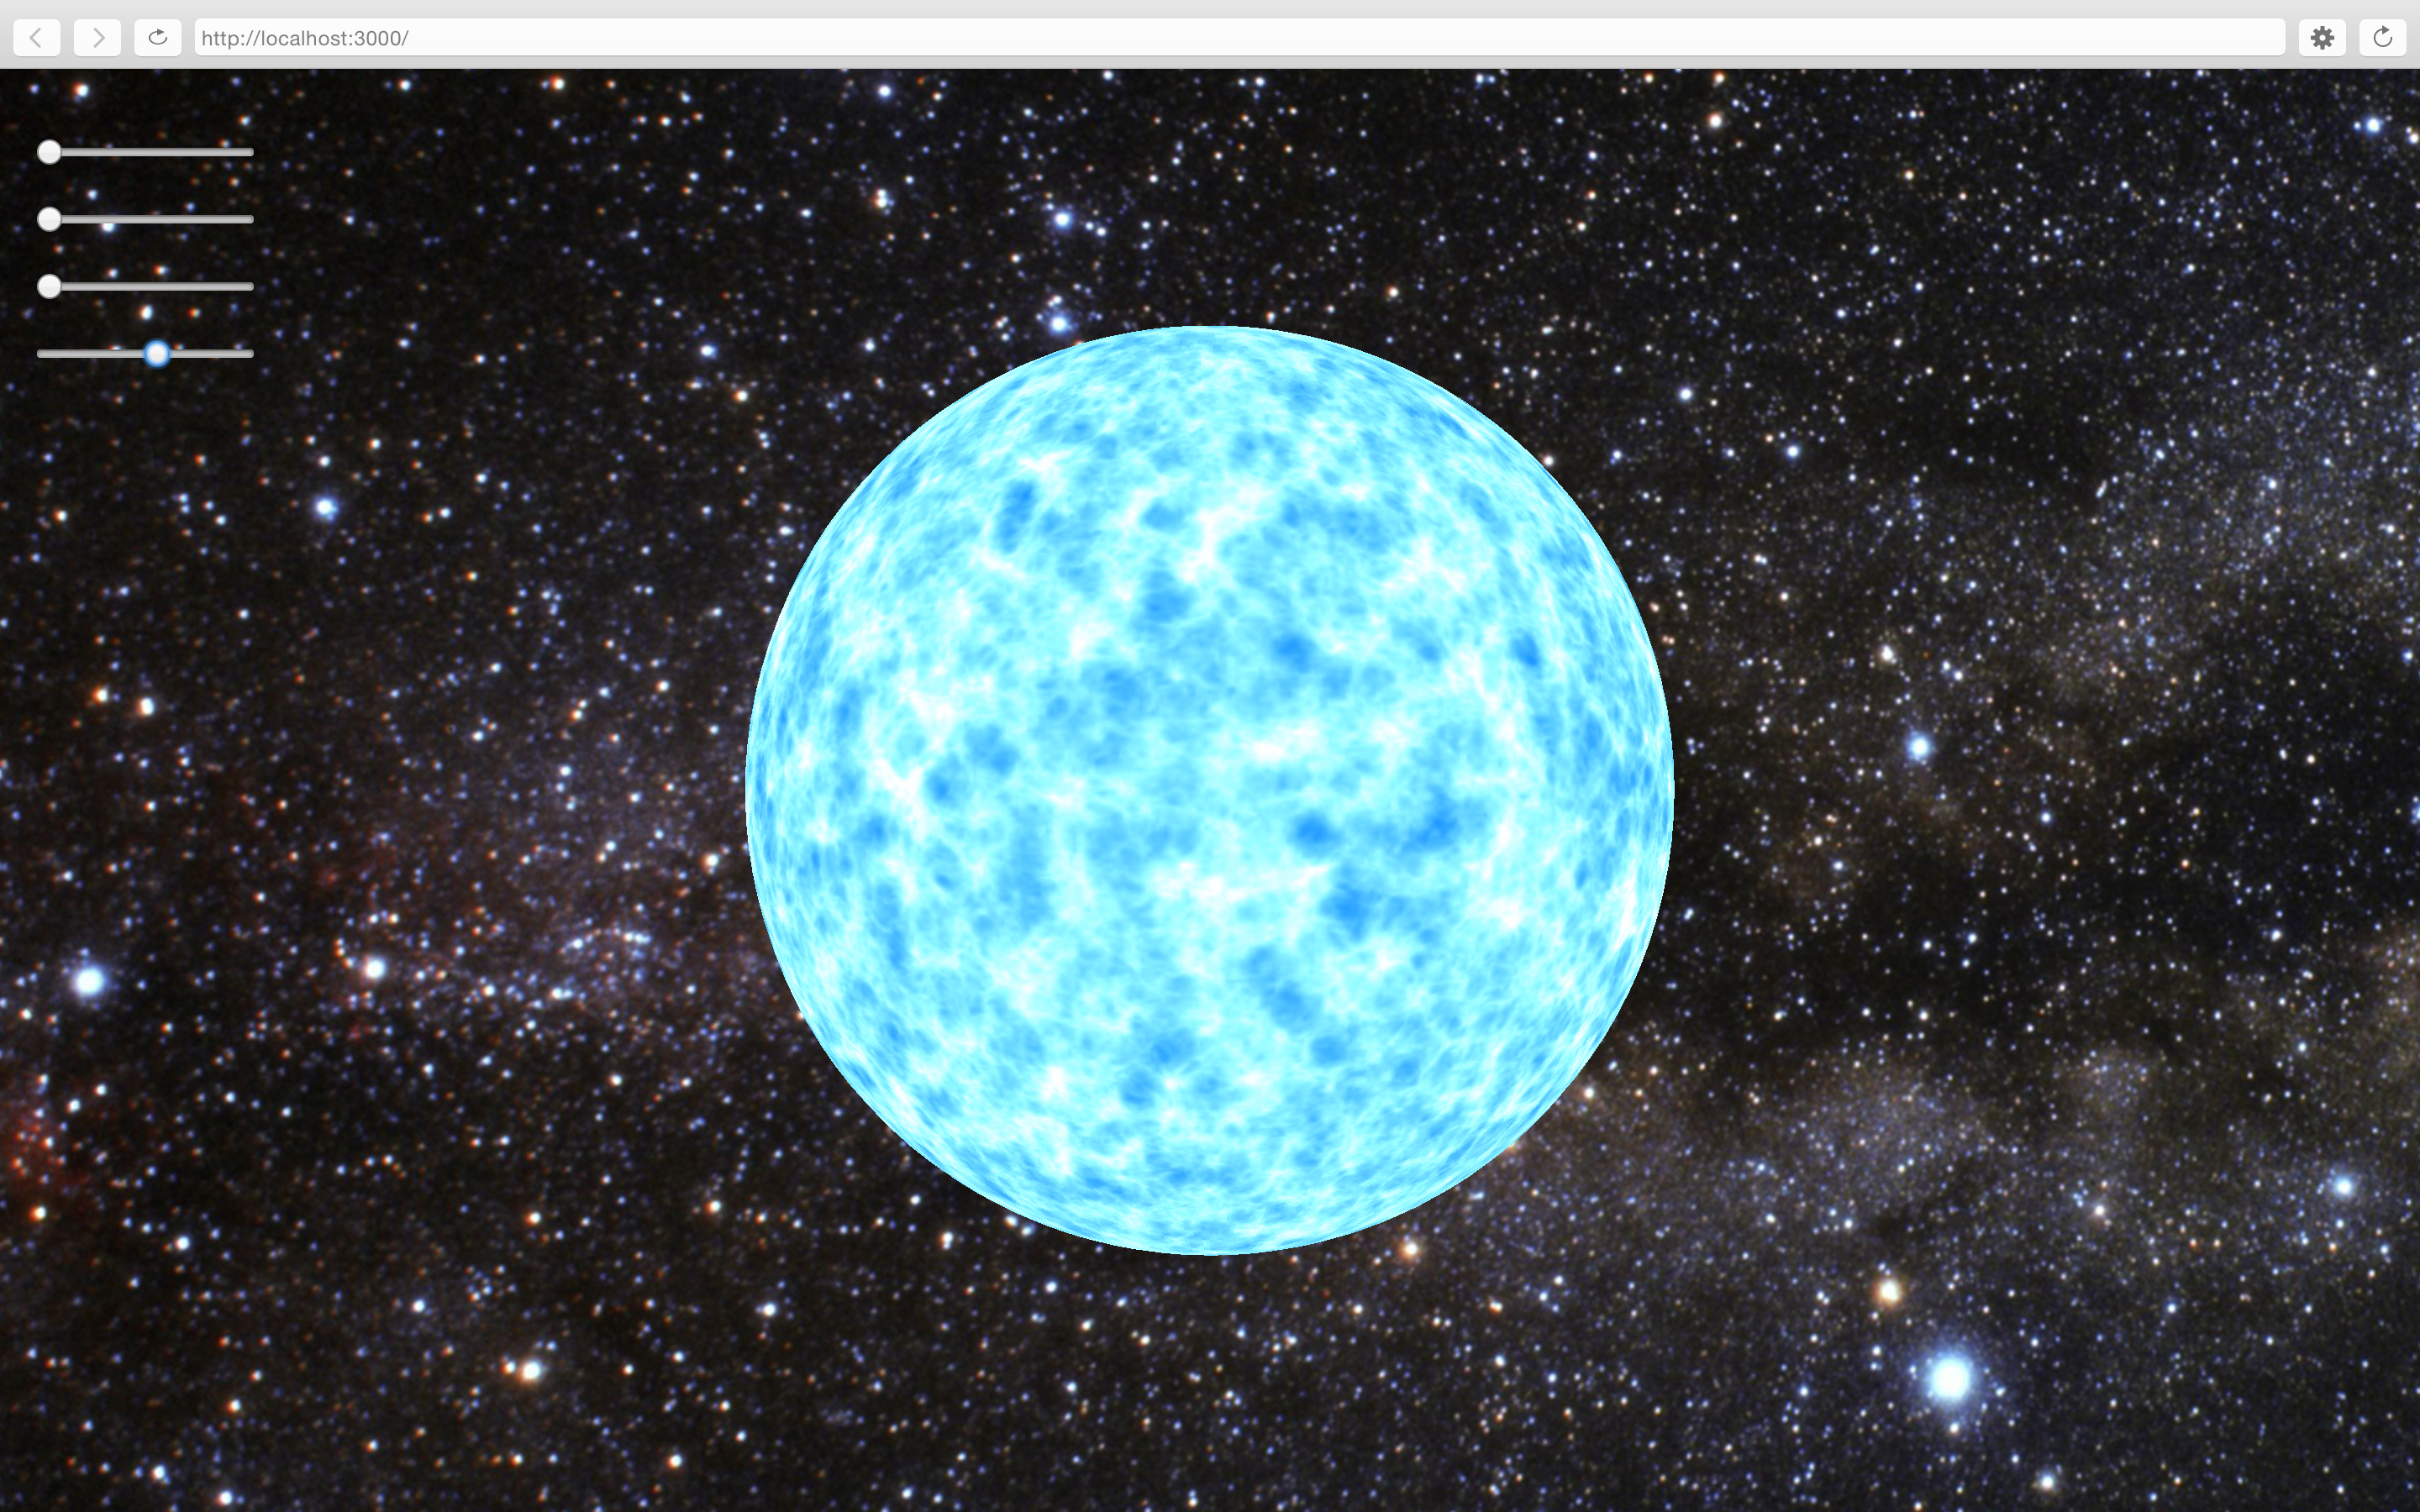
11/18/15
Playtest version 1.0
I built this version in P5 but I will be experimenting with other languages to get something closer in appearance to what I can animate in blender. This version covers planet, brown dwarf, red, yellow, white, and blue star masses. The sliders orbit and scale the object.
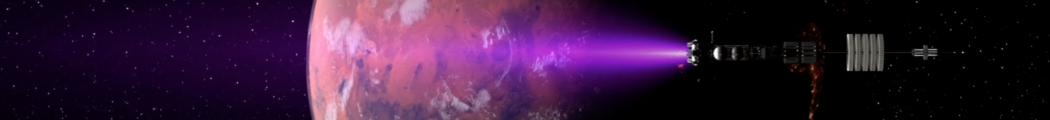
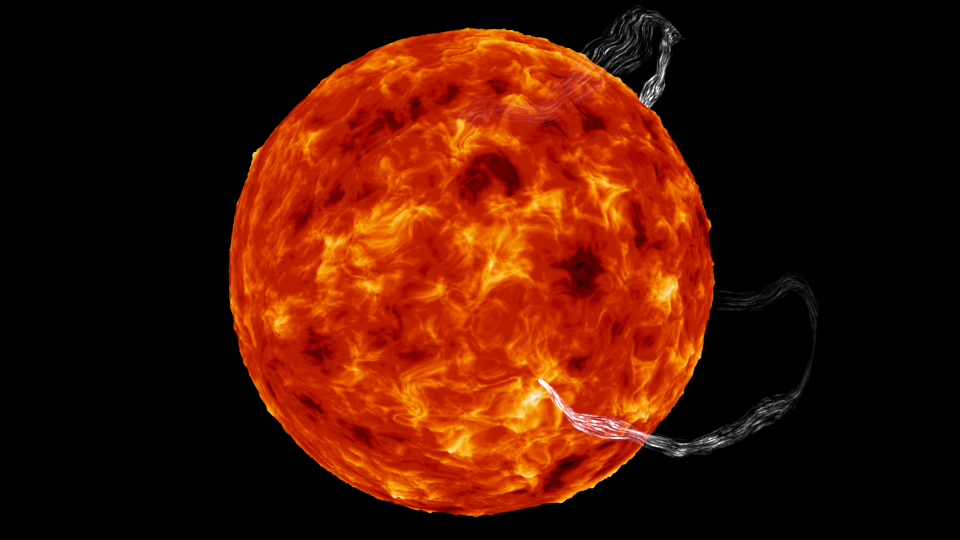
This is a preview of the multilayer, richer animation I would like to use.
11/12/15
Solar System Builder
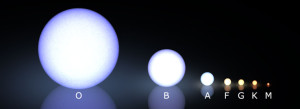
An interactive visual illustration of how available mass can mean the difference between a dwarf planet, a terrestrial planet, a gas giant, or a star.
The user starts with a small amalgamation of dust and gas which is enough to form a small asteroid, by adding material it changes into a dwarf planet, by adding more it becomes a small planet capable of holding onto an atmosphere, still more matter creates an earth like planet, more and you get a small, medium, and then large gas giant. Keep adding dust and gas and the gas giant begins to fuse atoms in it’s core and becomes a star, as the star climbs in mass it moves through the spectral classes all the way to blue hypergiant.
I have always had a strong interest in astronomy and planetology. Two of my favorite pages on wikipedia cover stars and exoplanets. The recent presentation in Applications by Carter Emmart sparked my interest anew with his impressive visual atlas presentation.
Ideally I think this project would find it’s intended audience as a video kiosk in a science museum. Anyone that is curious about outer space, planets, stars, the formation of the earth, and the sun would make a good target for the experience.
The questions I have for the class would be: Does the proposed interaction generate interest? Also, should I use P5, Processing, webgl, or a game engine?
I took some inspiration from:
http://dinosaurpictures.org/ancient-earth/#600
11/10/15
Figured out how to do this.
11/5/15
Just found this:
Traffic Accidents Mapped
11/4/15
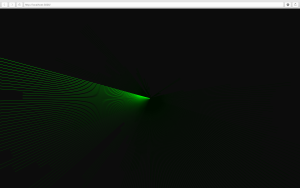
Radial waveform.
The green line sweeps around the page and gets longer with mic input.
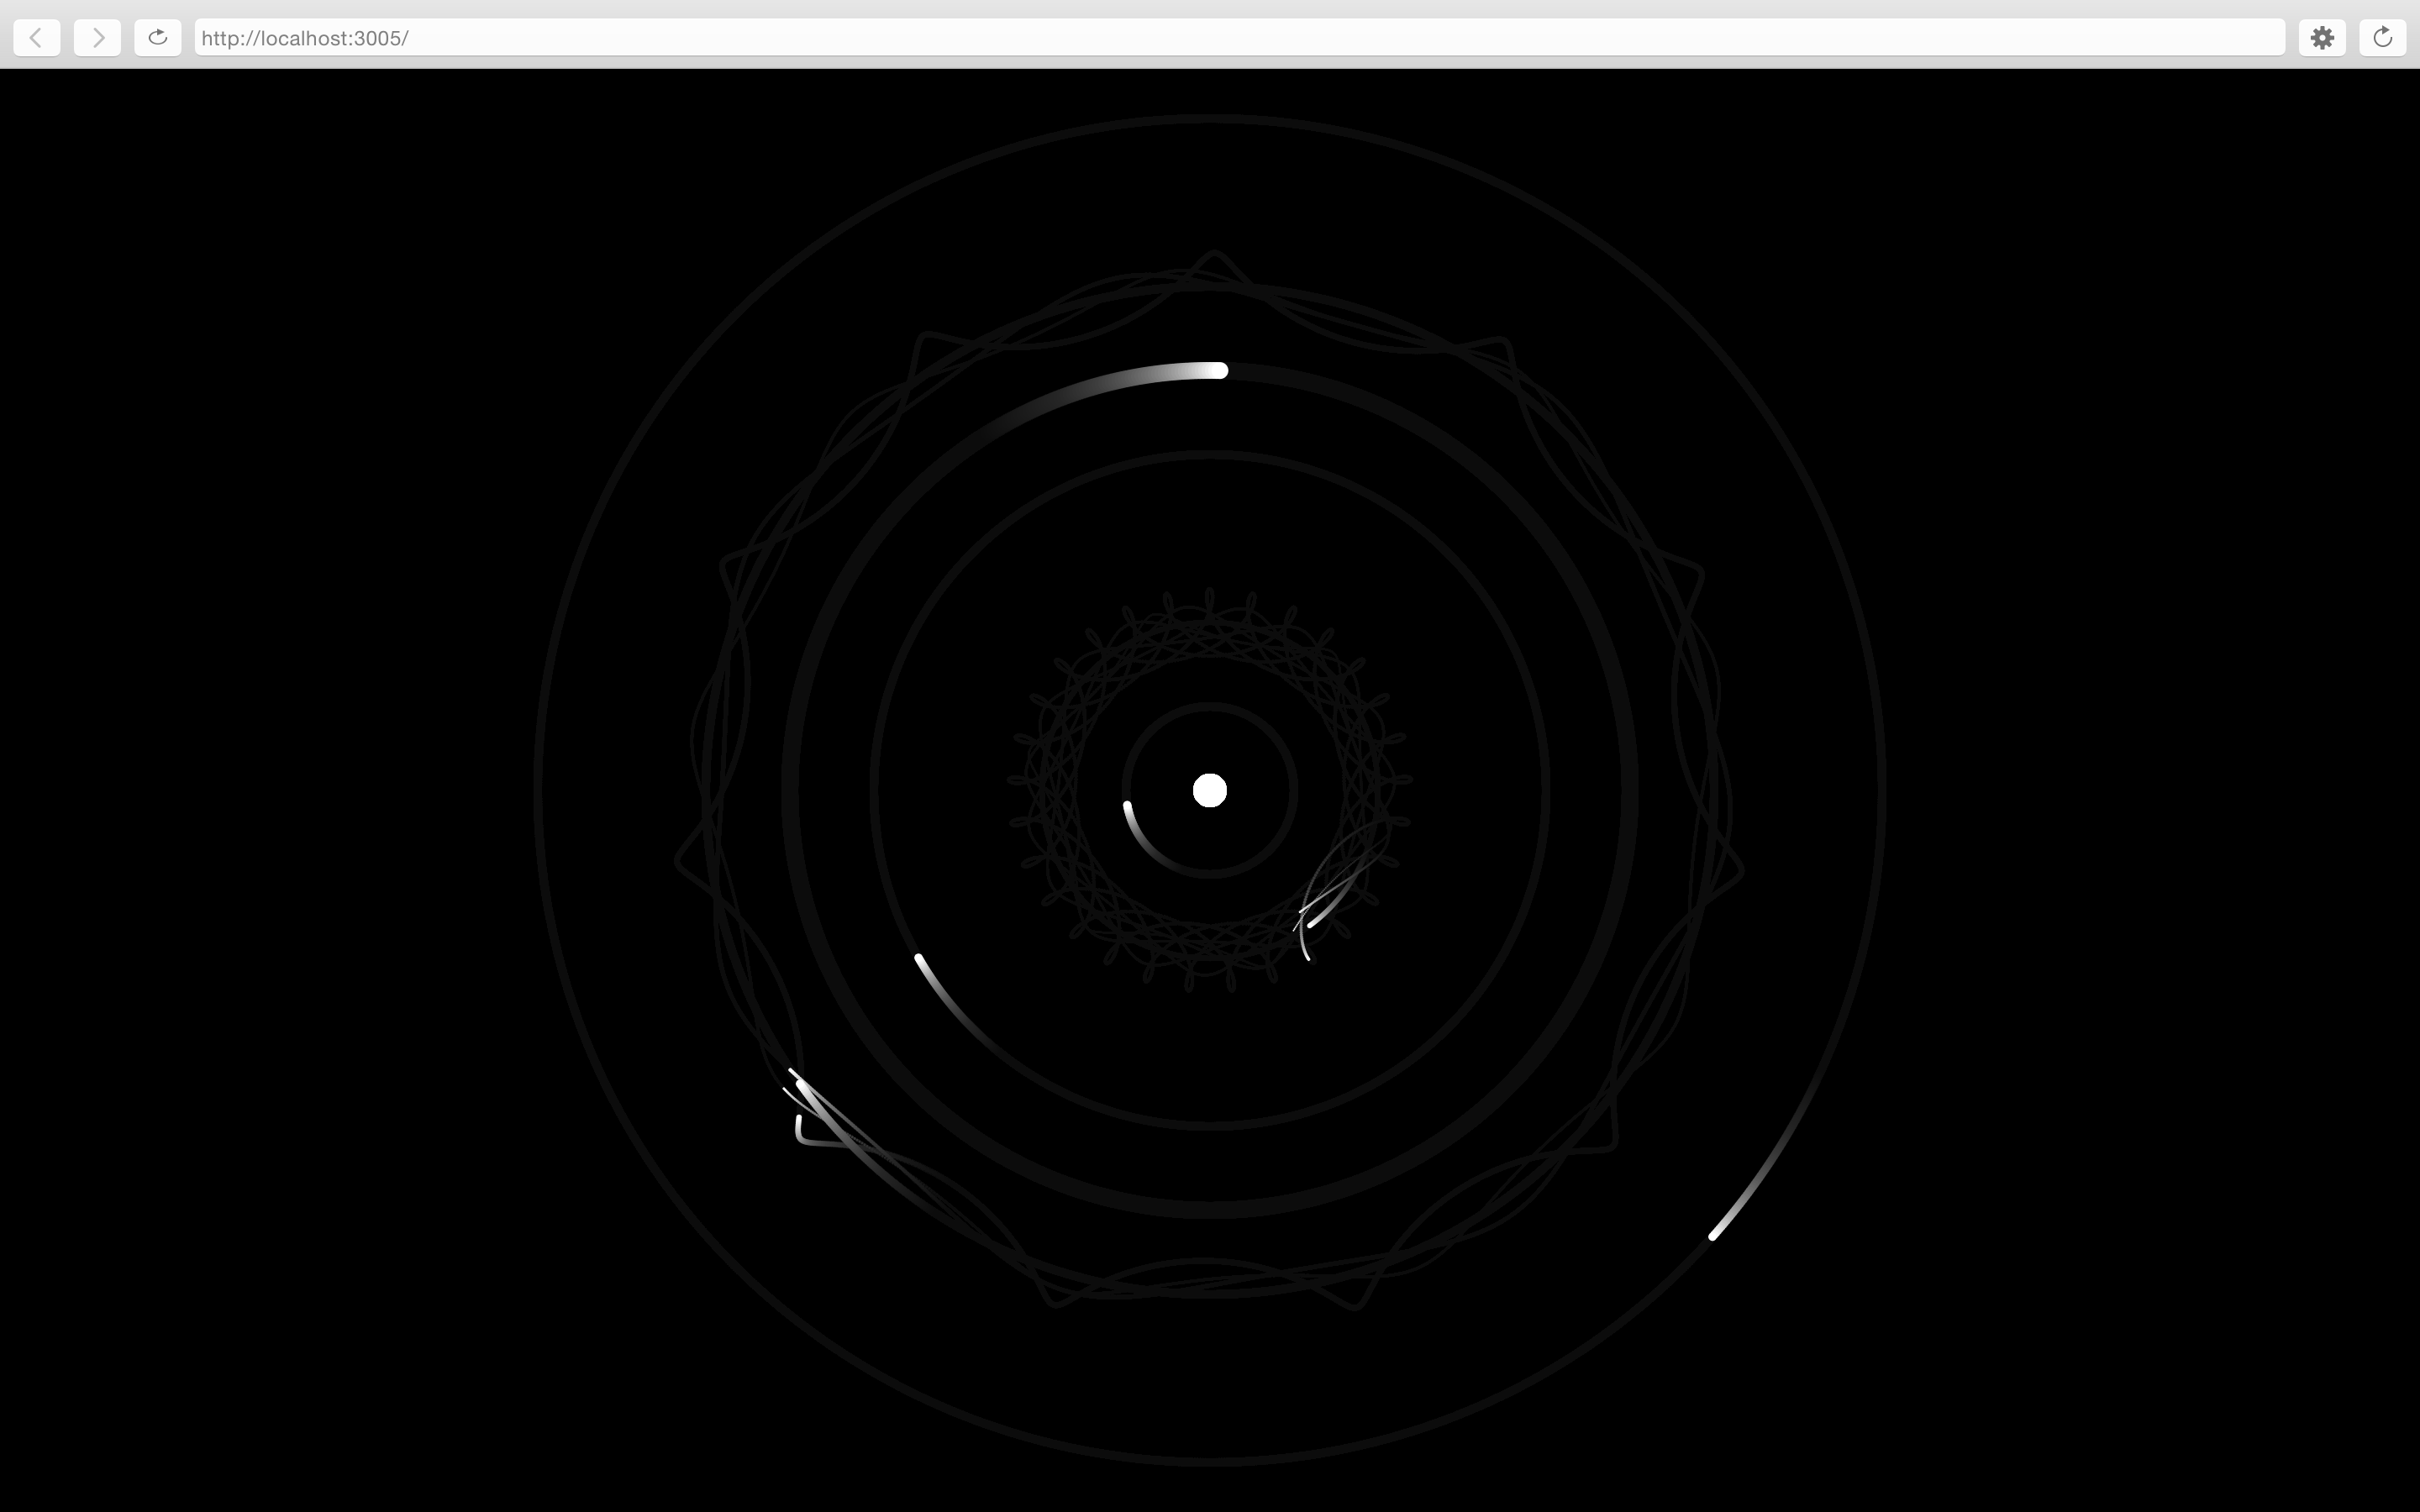
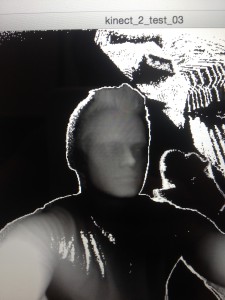
Figured out how to make this miniature star, planet and moon sketch with some help from Moon!
Also learned how to use the kinect with Processing.
Here are some things that inspired me this week.
10/29/15
Playing with sound triggering.
Something silly for Halloween.
10/22/15
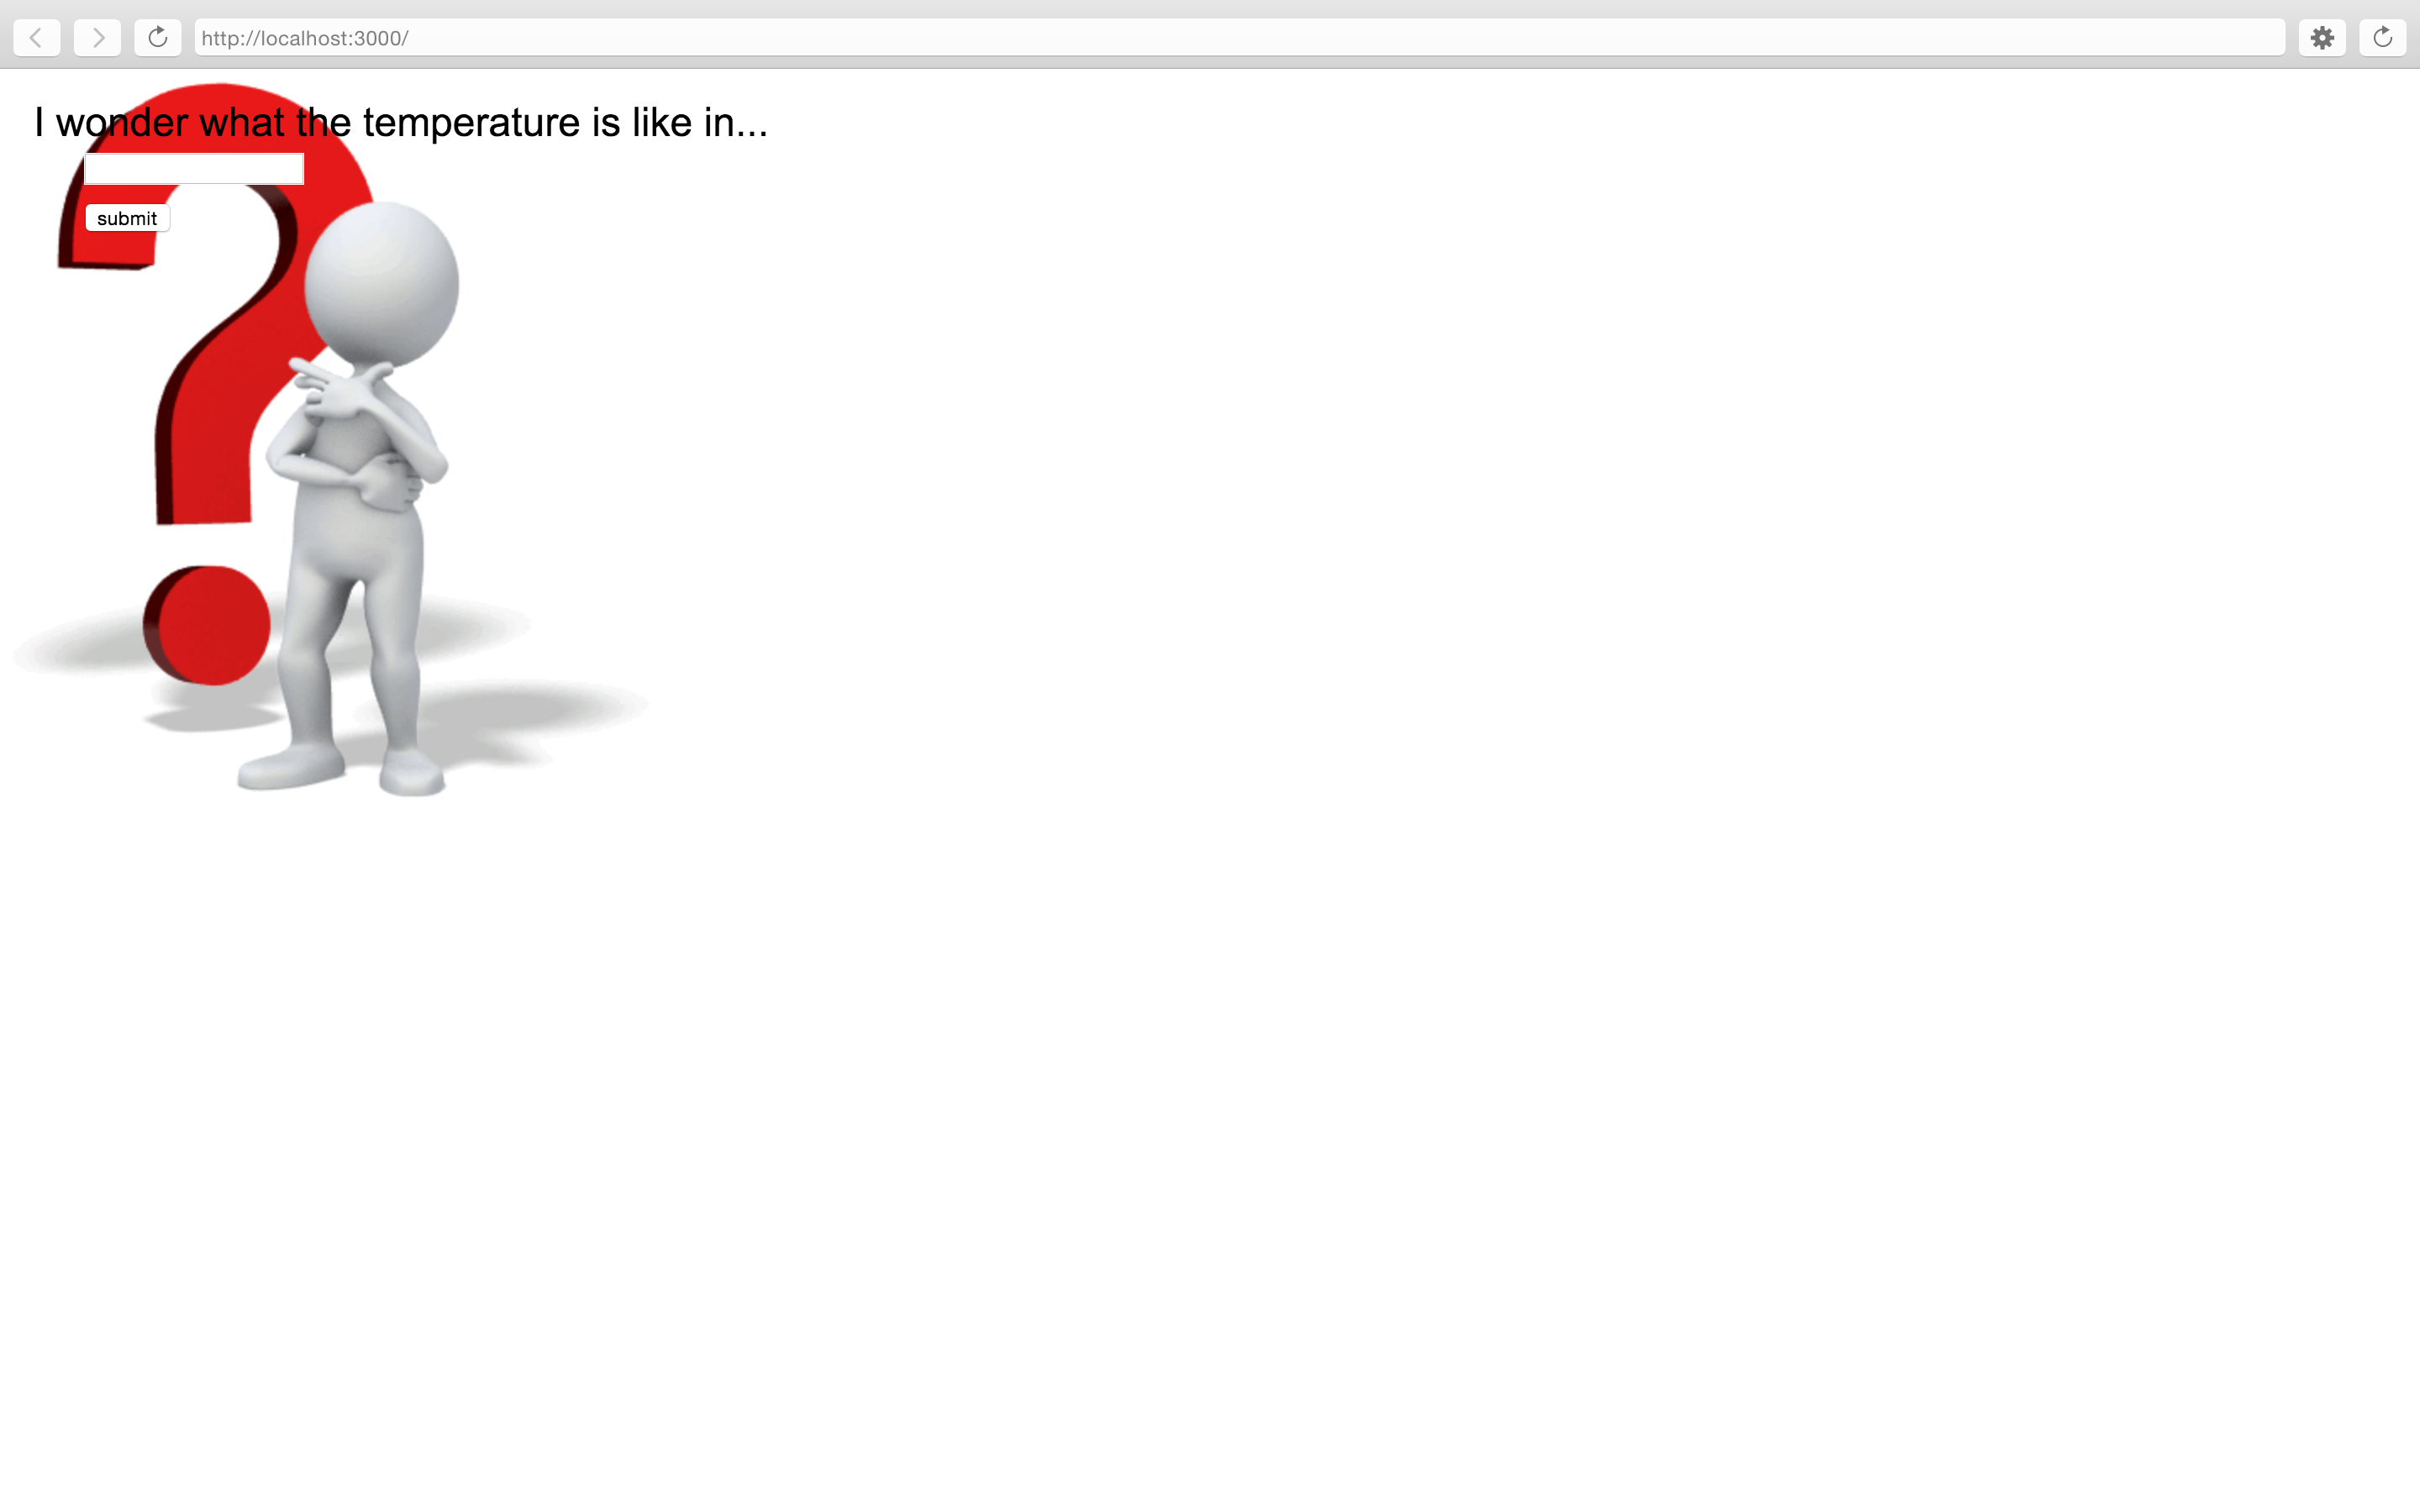
So many variables to keep track of when pulling data from the web!
I was inspired by stuff like this…
http://www.flightradar24.com/
http://globe.cid.harvard.edu/
http://www.theatlantic.com/health/archive/2013/10/a-real-time-map-of-births-and-deaths/280609/
After experimenting with a lot of stuff and not getting anywhere, I ended up doing something snarky, and simple for this week’s homework.
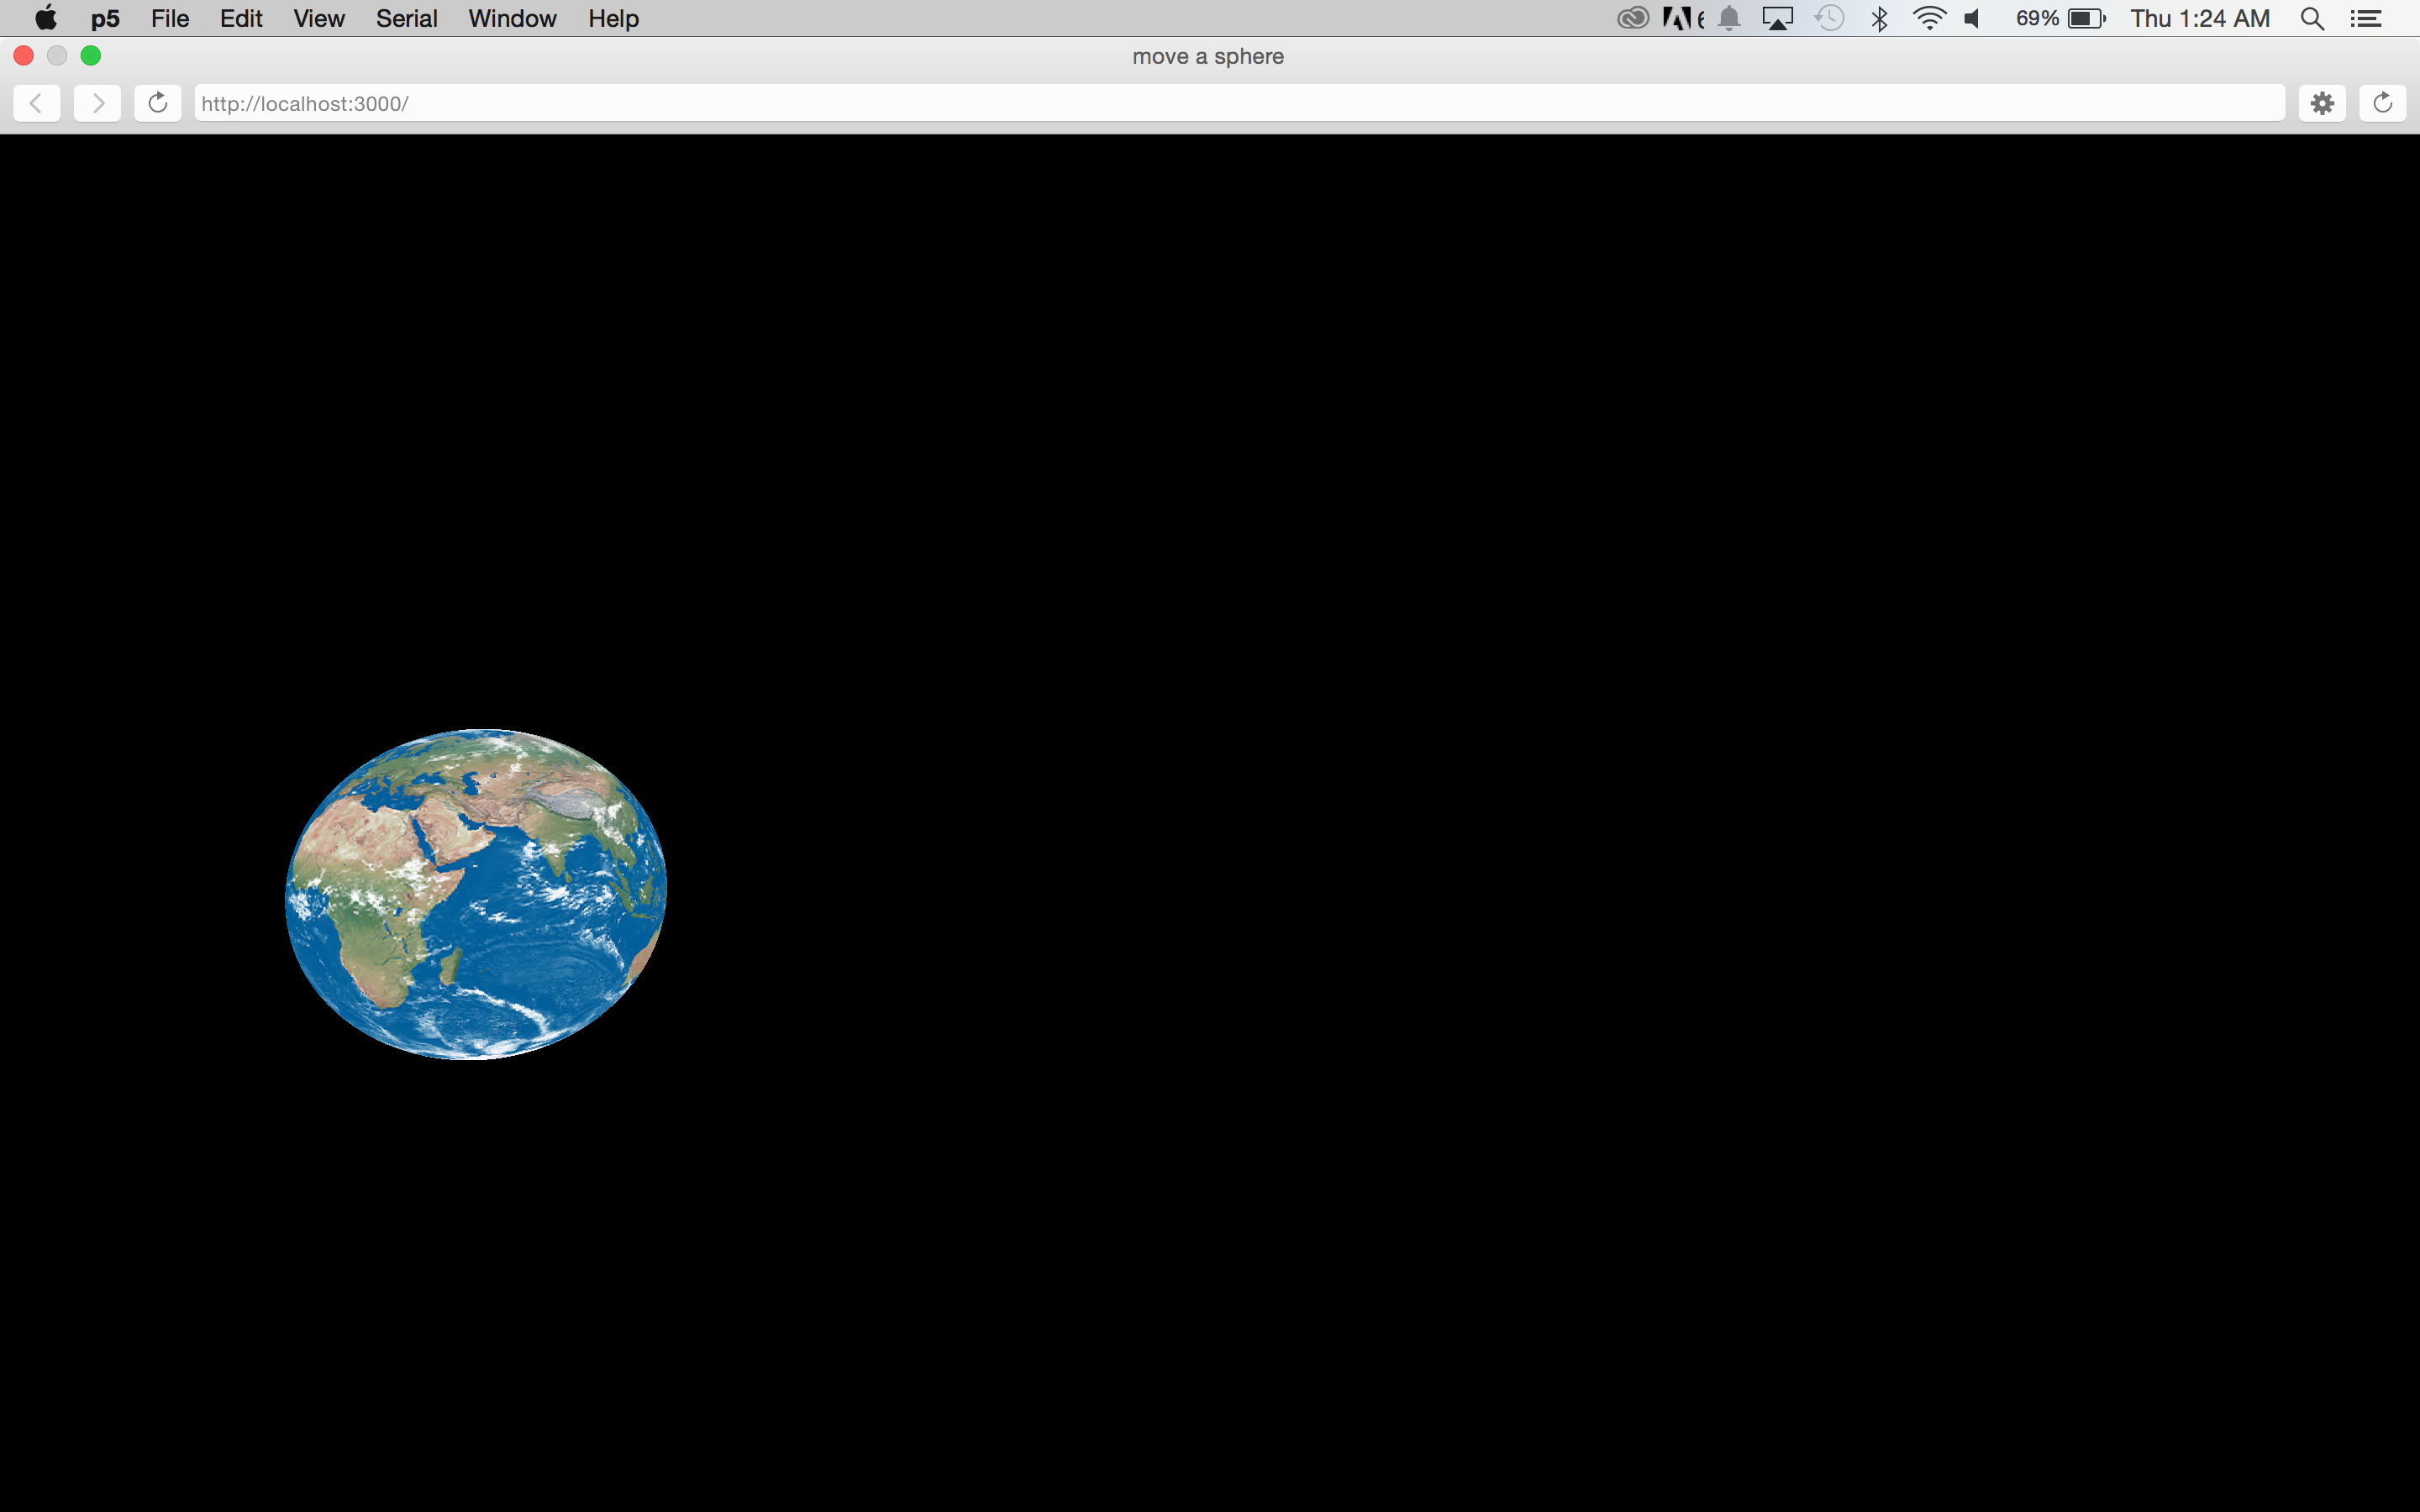
10/21/15
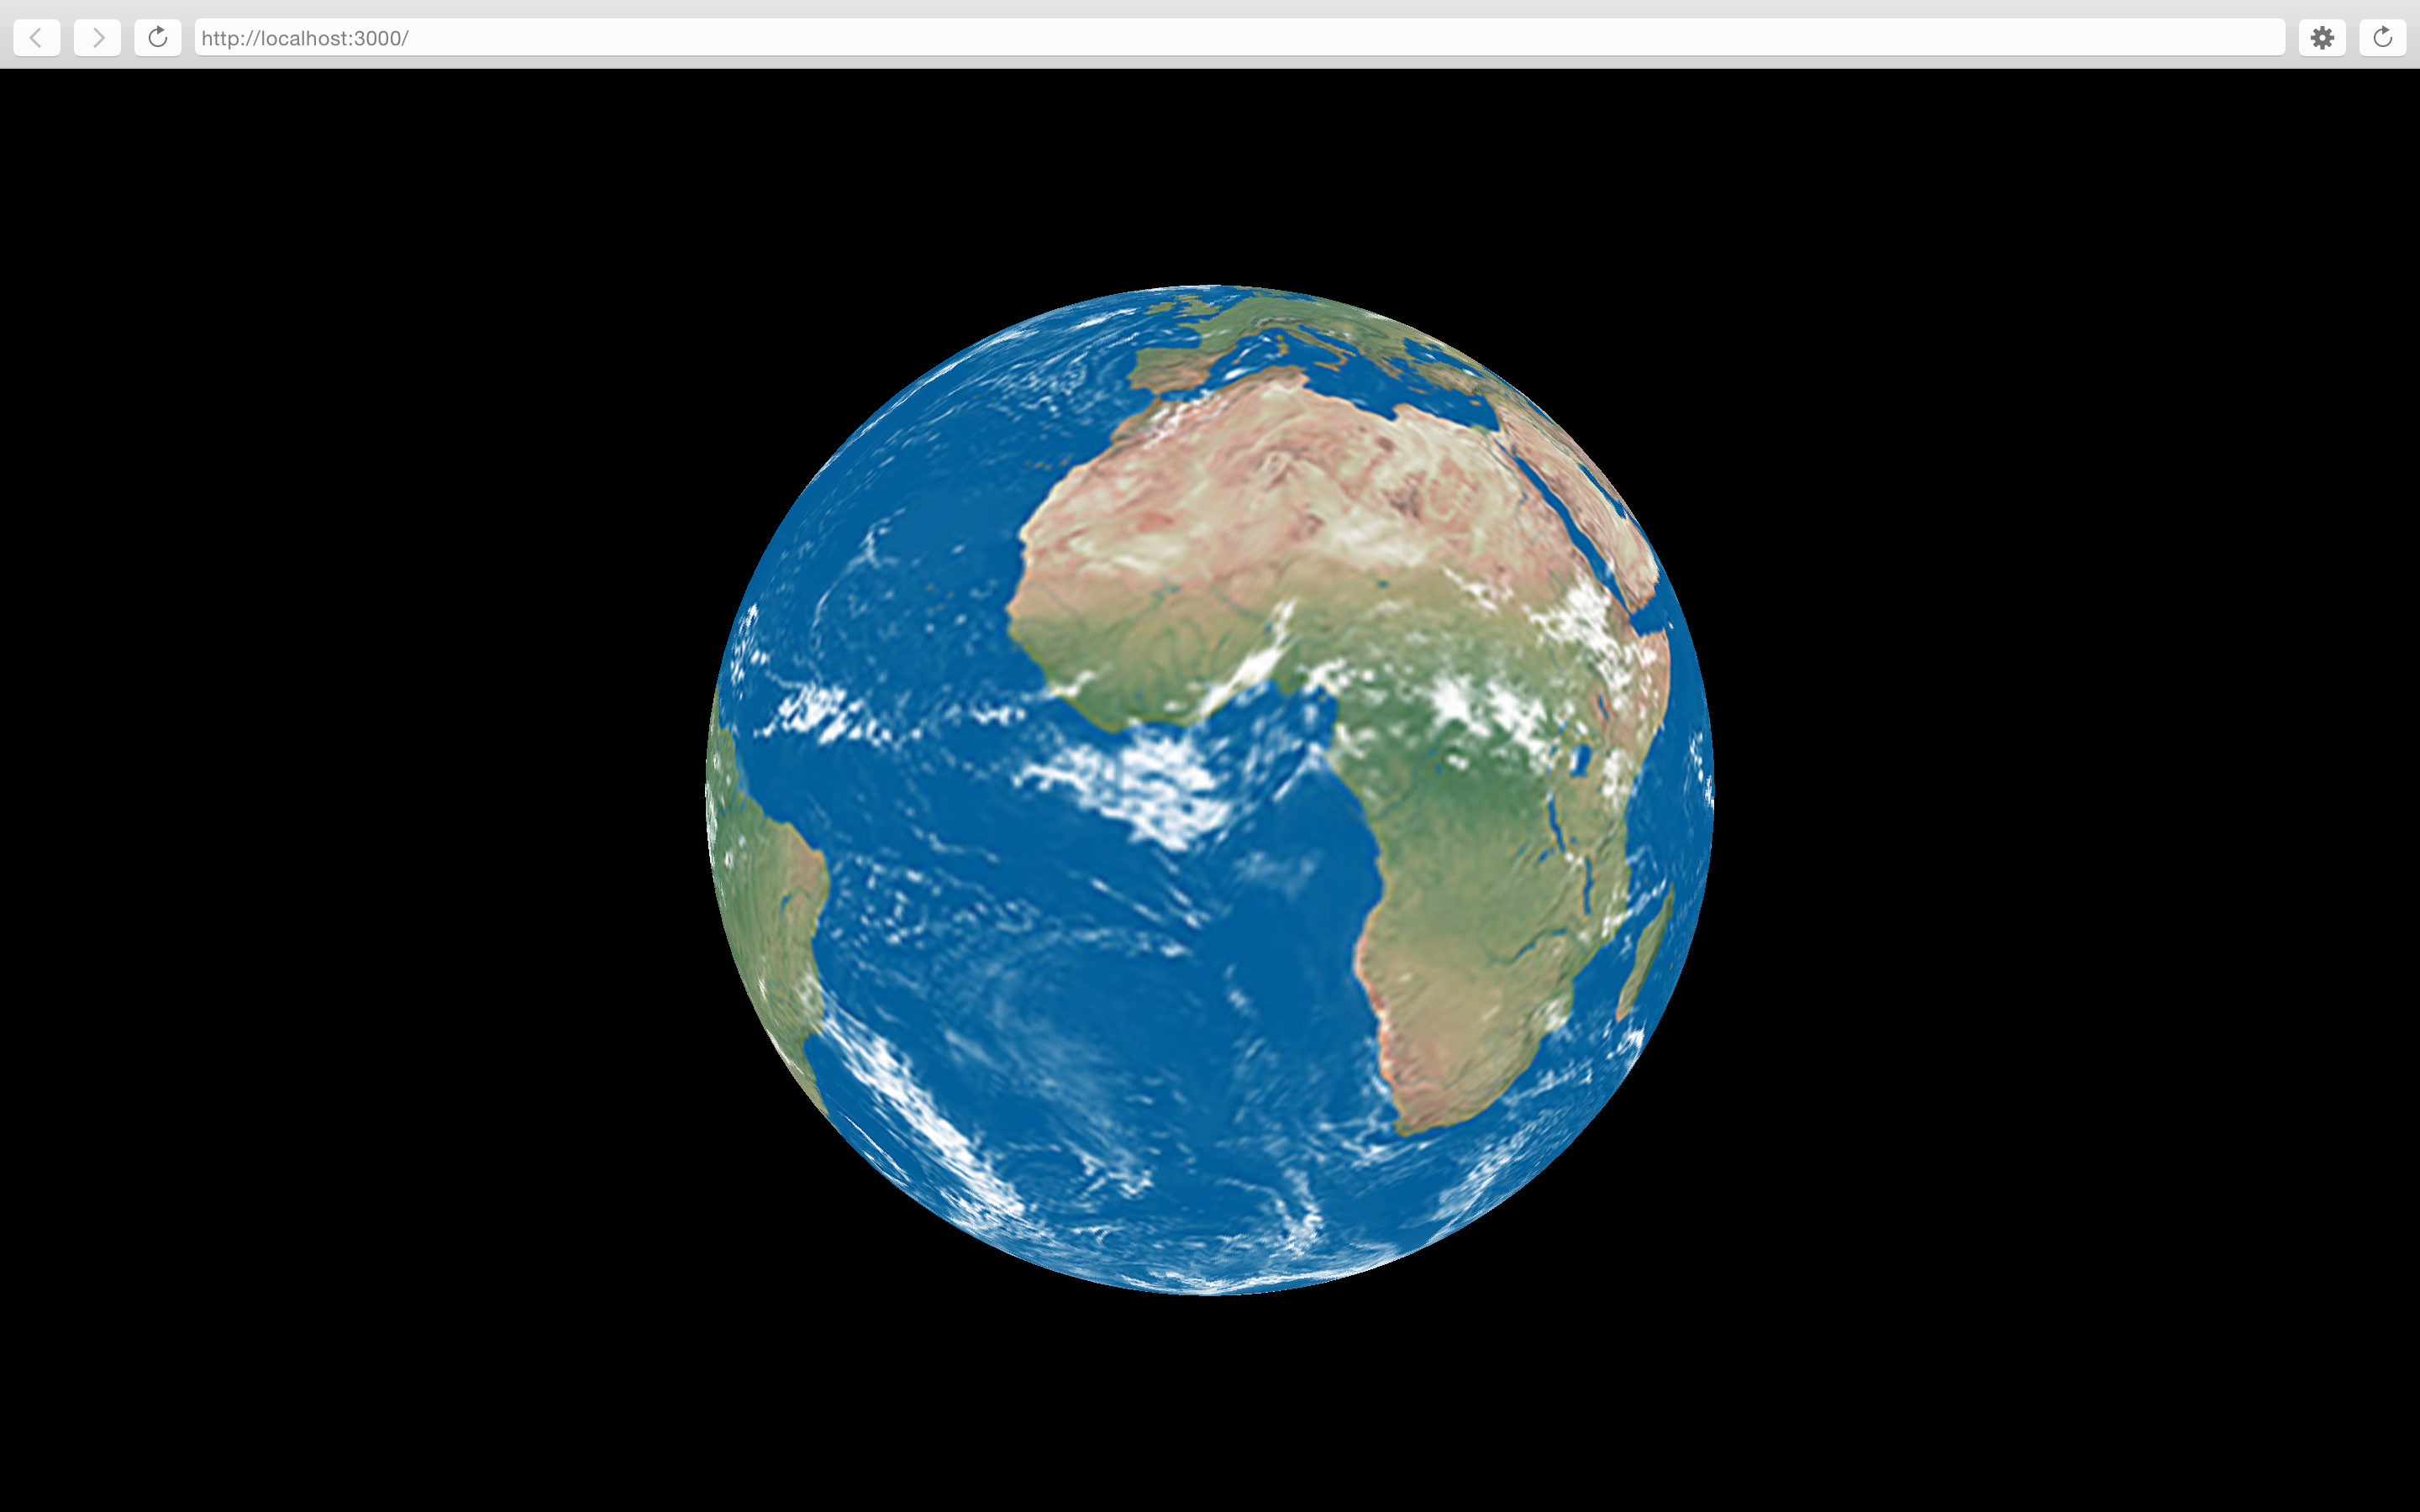
I used the P5 Globe sketch as a starting point for my Physical Computing Mid Term Project. Using an accelerometer in a microcontroller inside a styrofoam sphere to control the rotation of a 3D sphere mapped with a texture map of the earth from NASA.
10/19/15
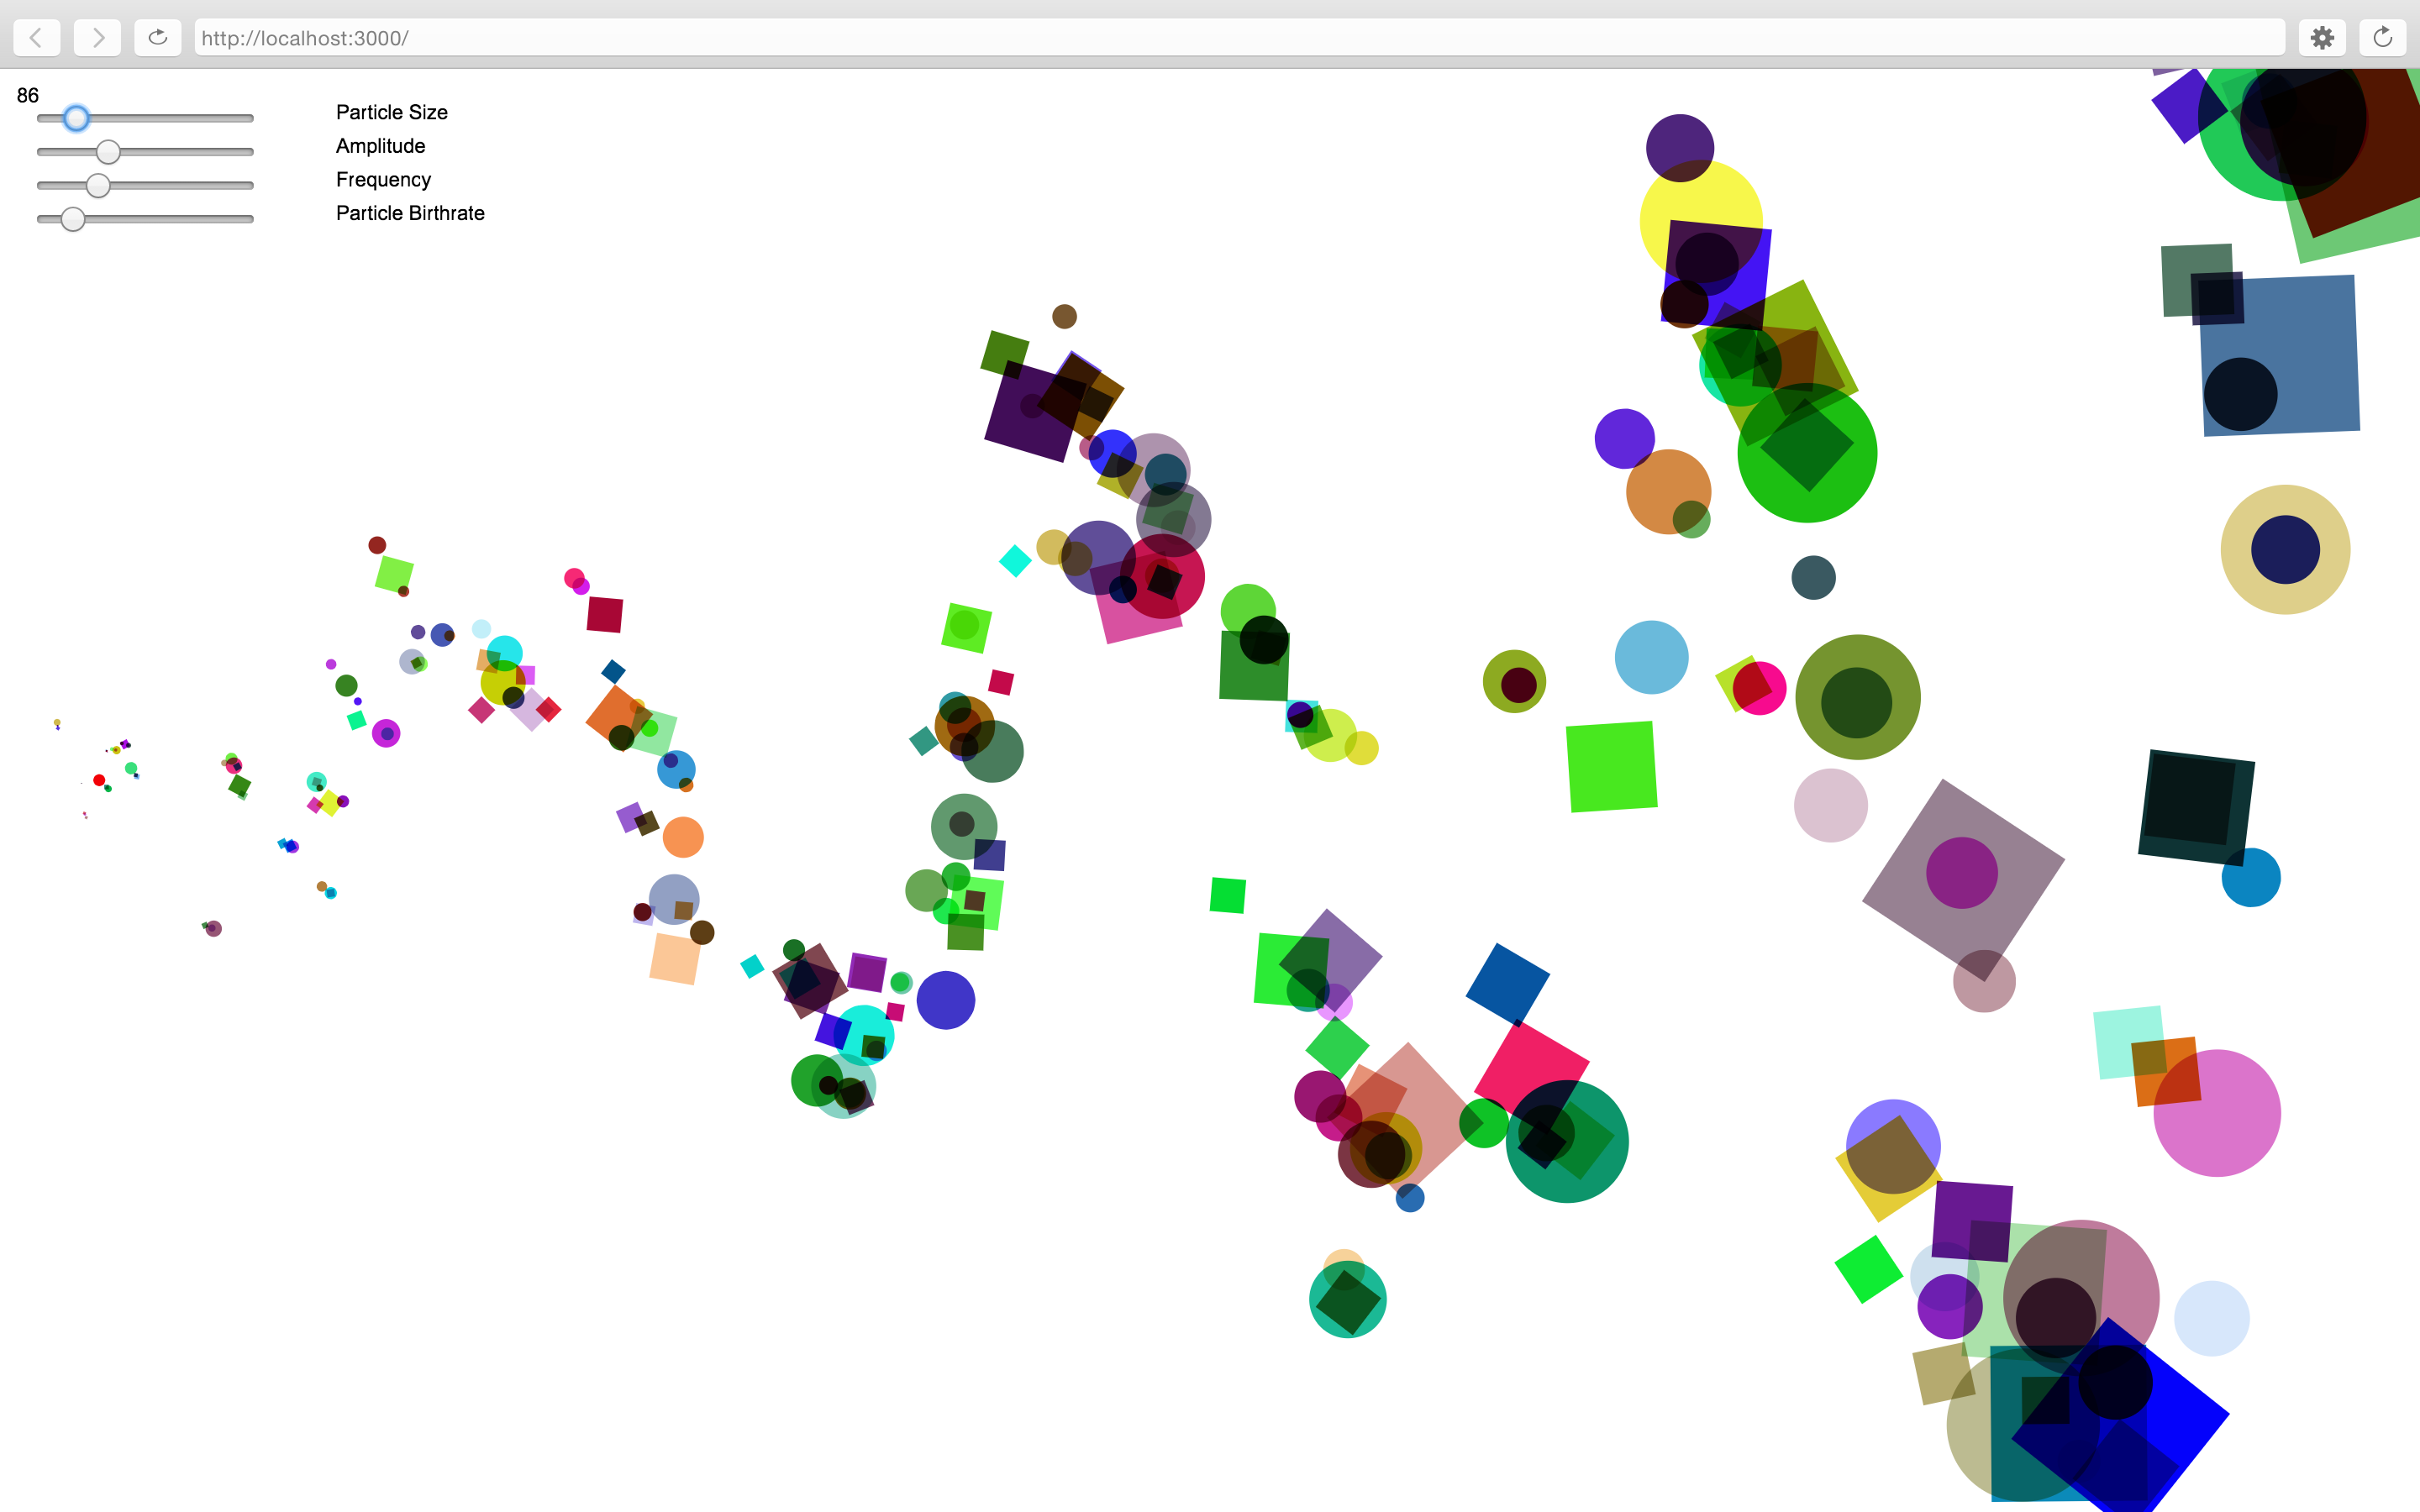
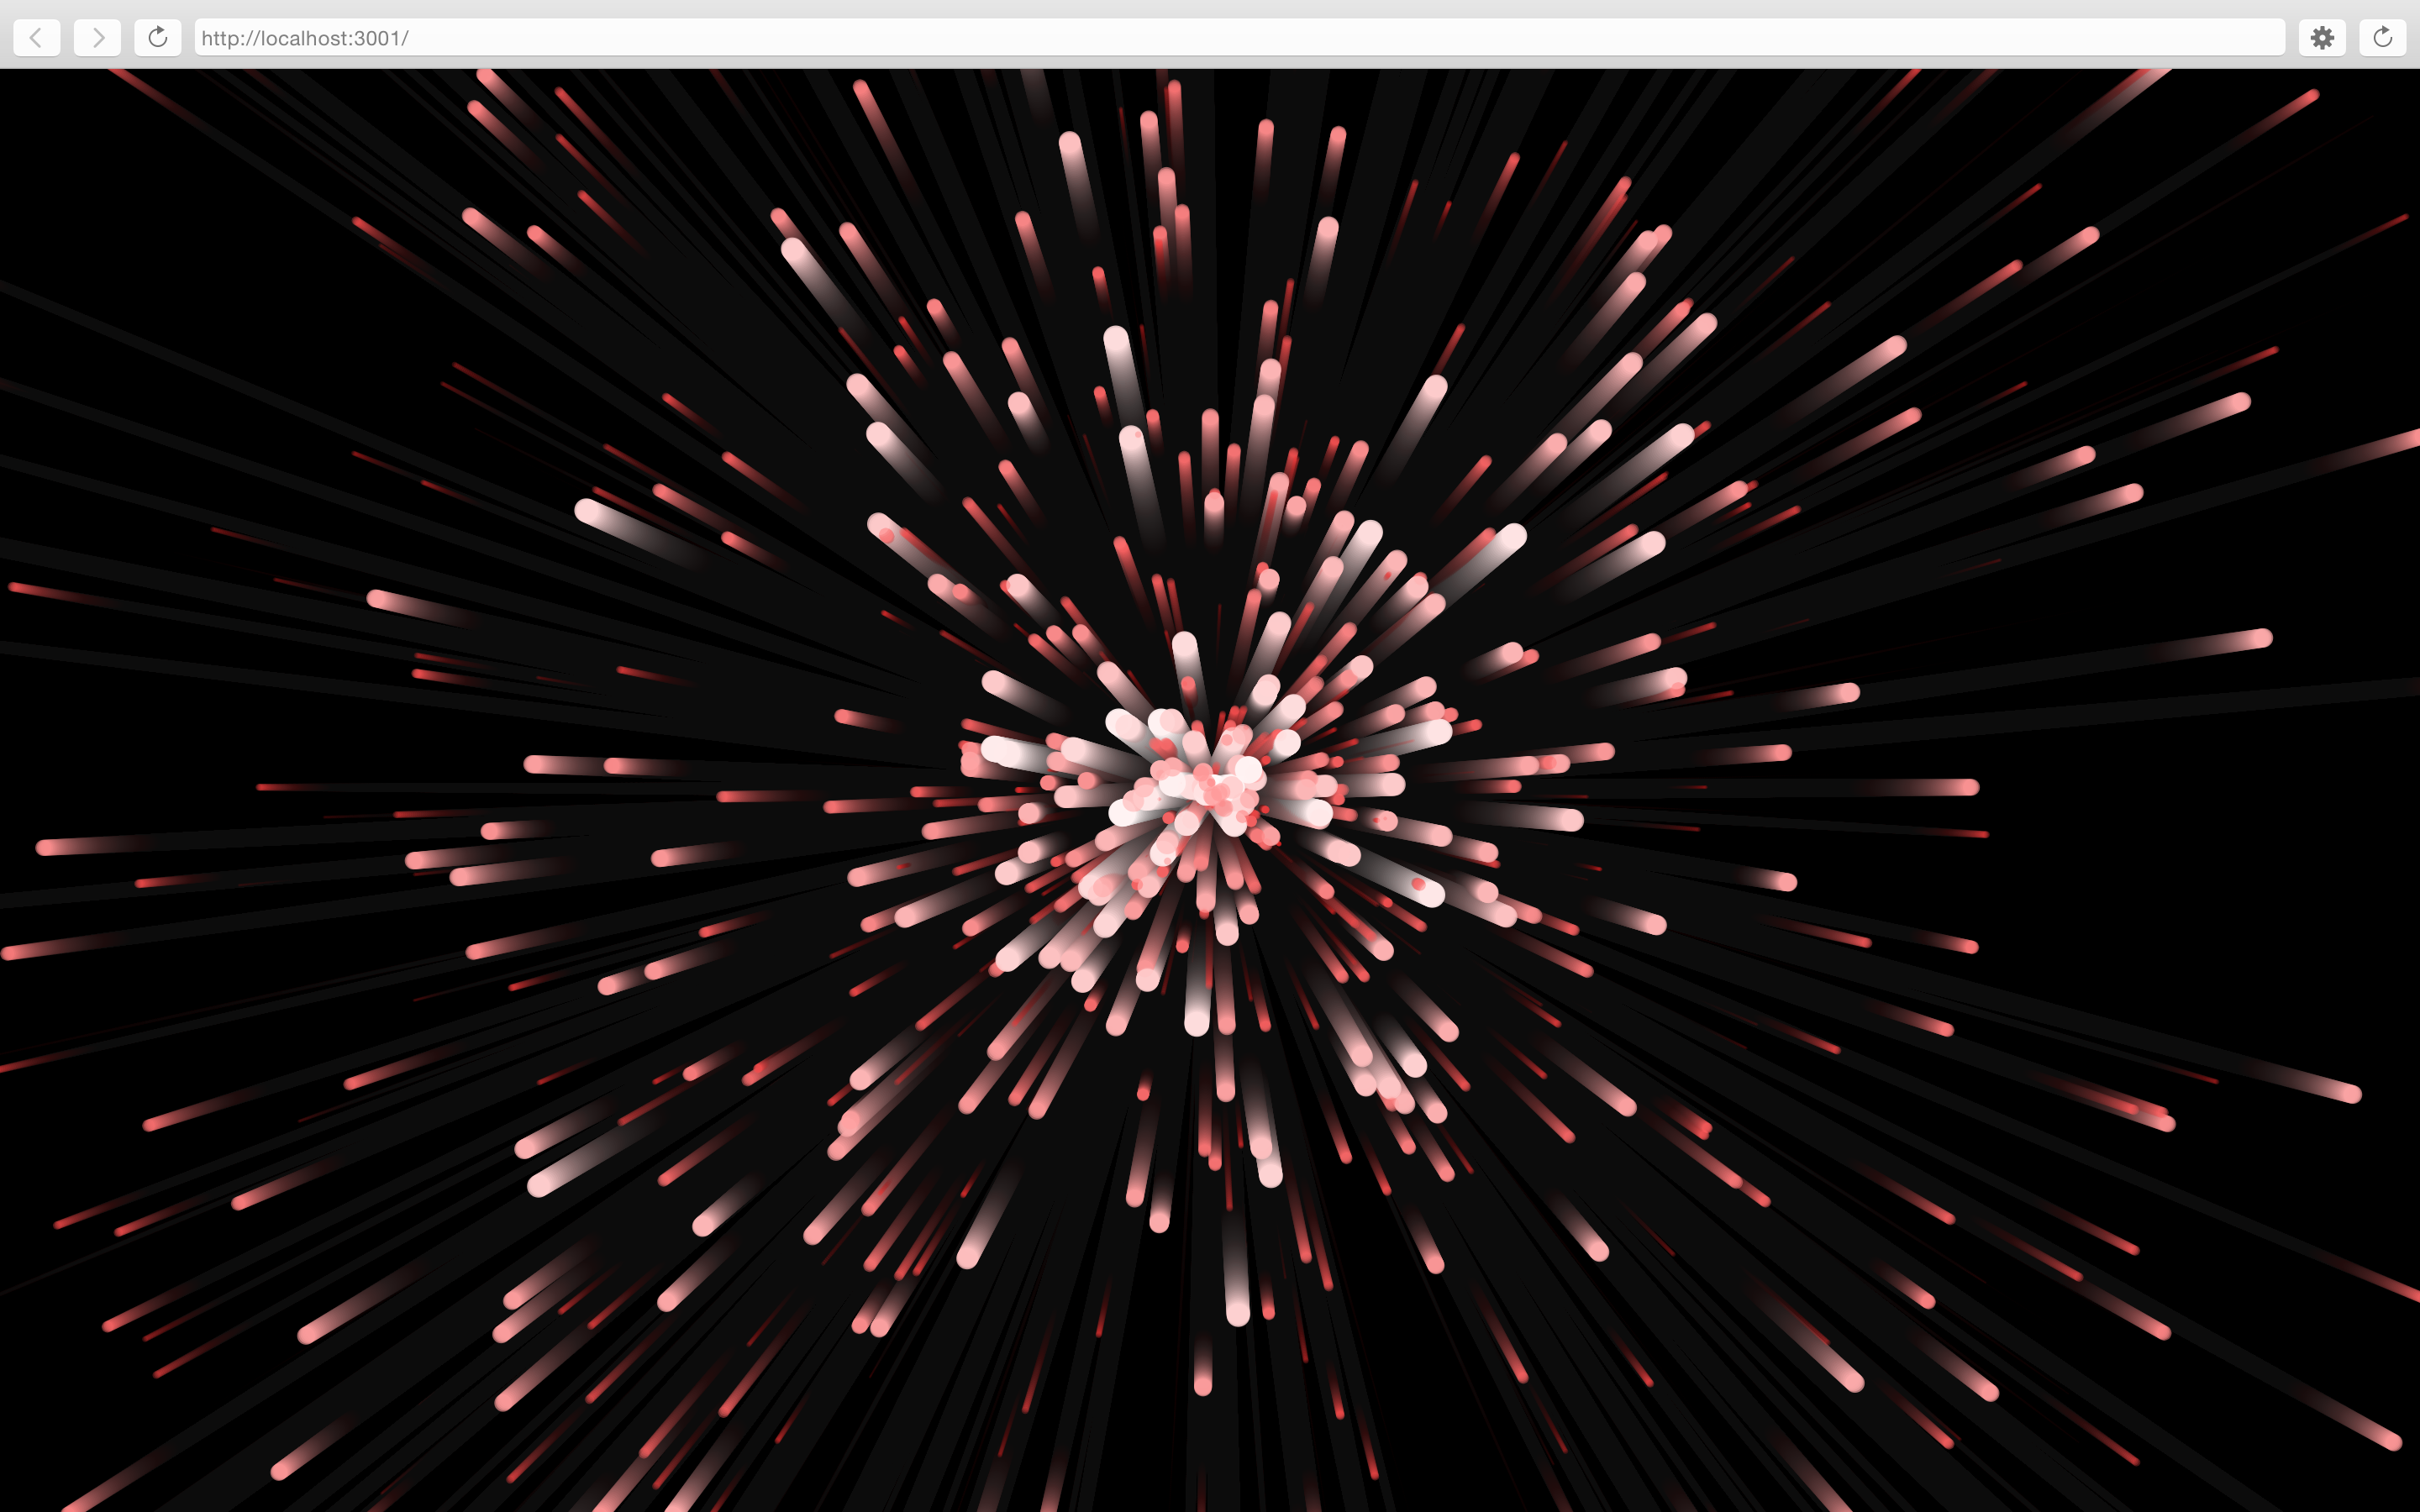
I went through the particle sketch and inserted slider values to make the particle size, amplitude, frequency and birthrate adjustable in the sketch. Very satisfying.
10/17/15
Did a session with Moon on Saturday night. We went over API data import and made a nifty weather driven sketch. unfortunately I don’t have the key for it and I did not screenshot it 🙁
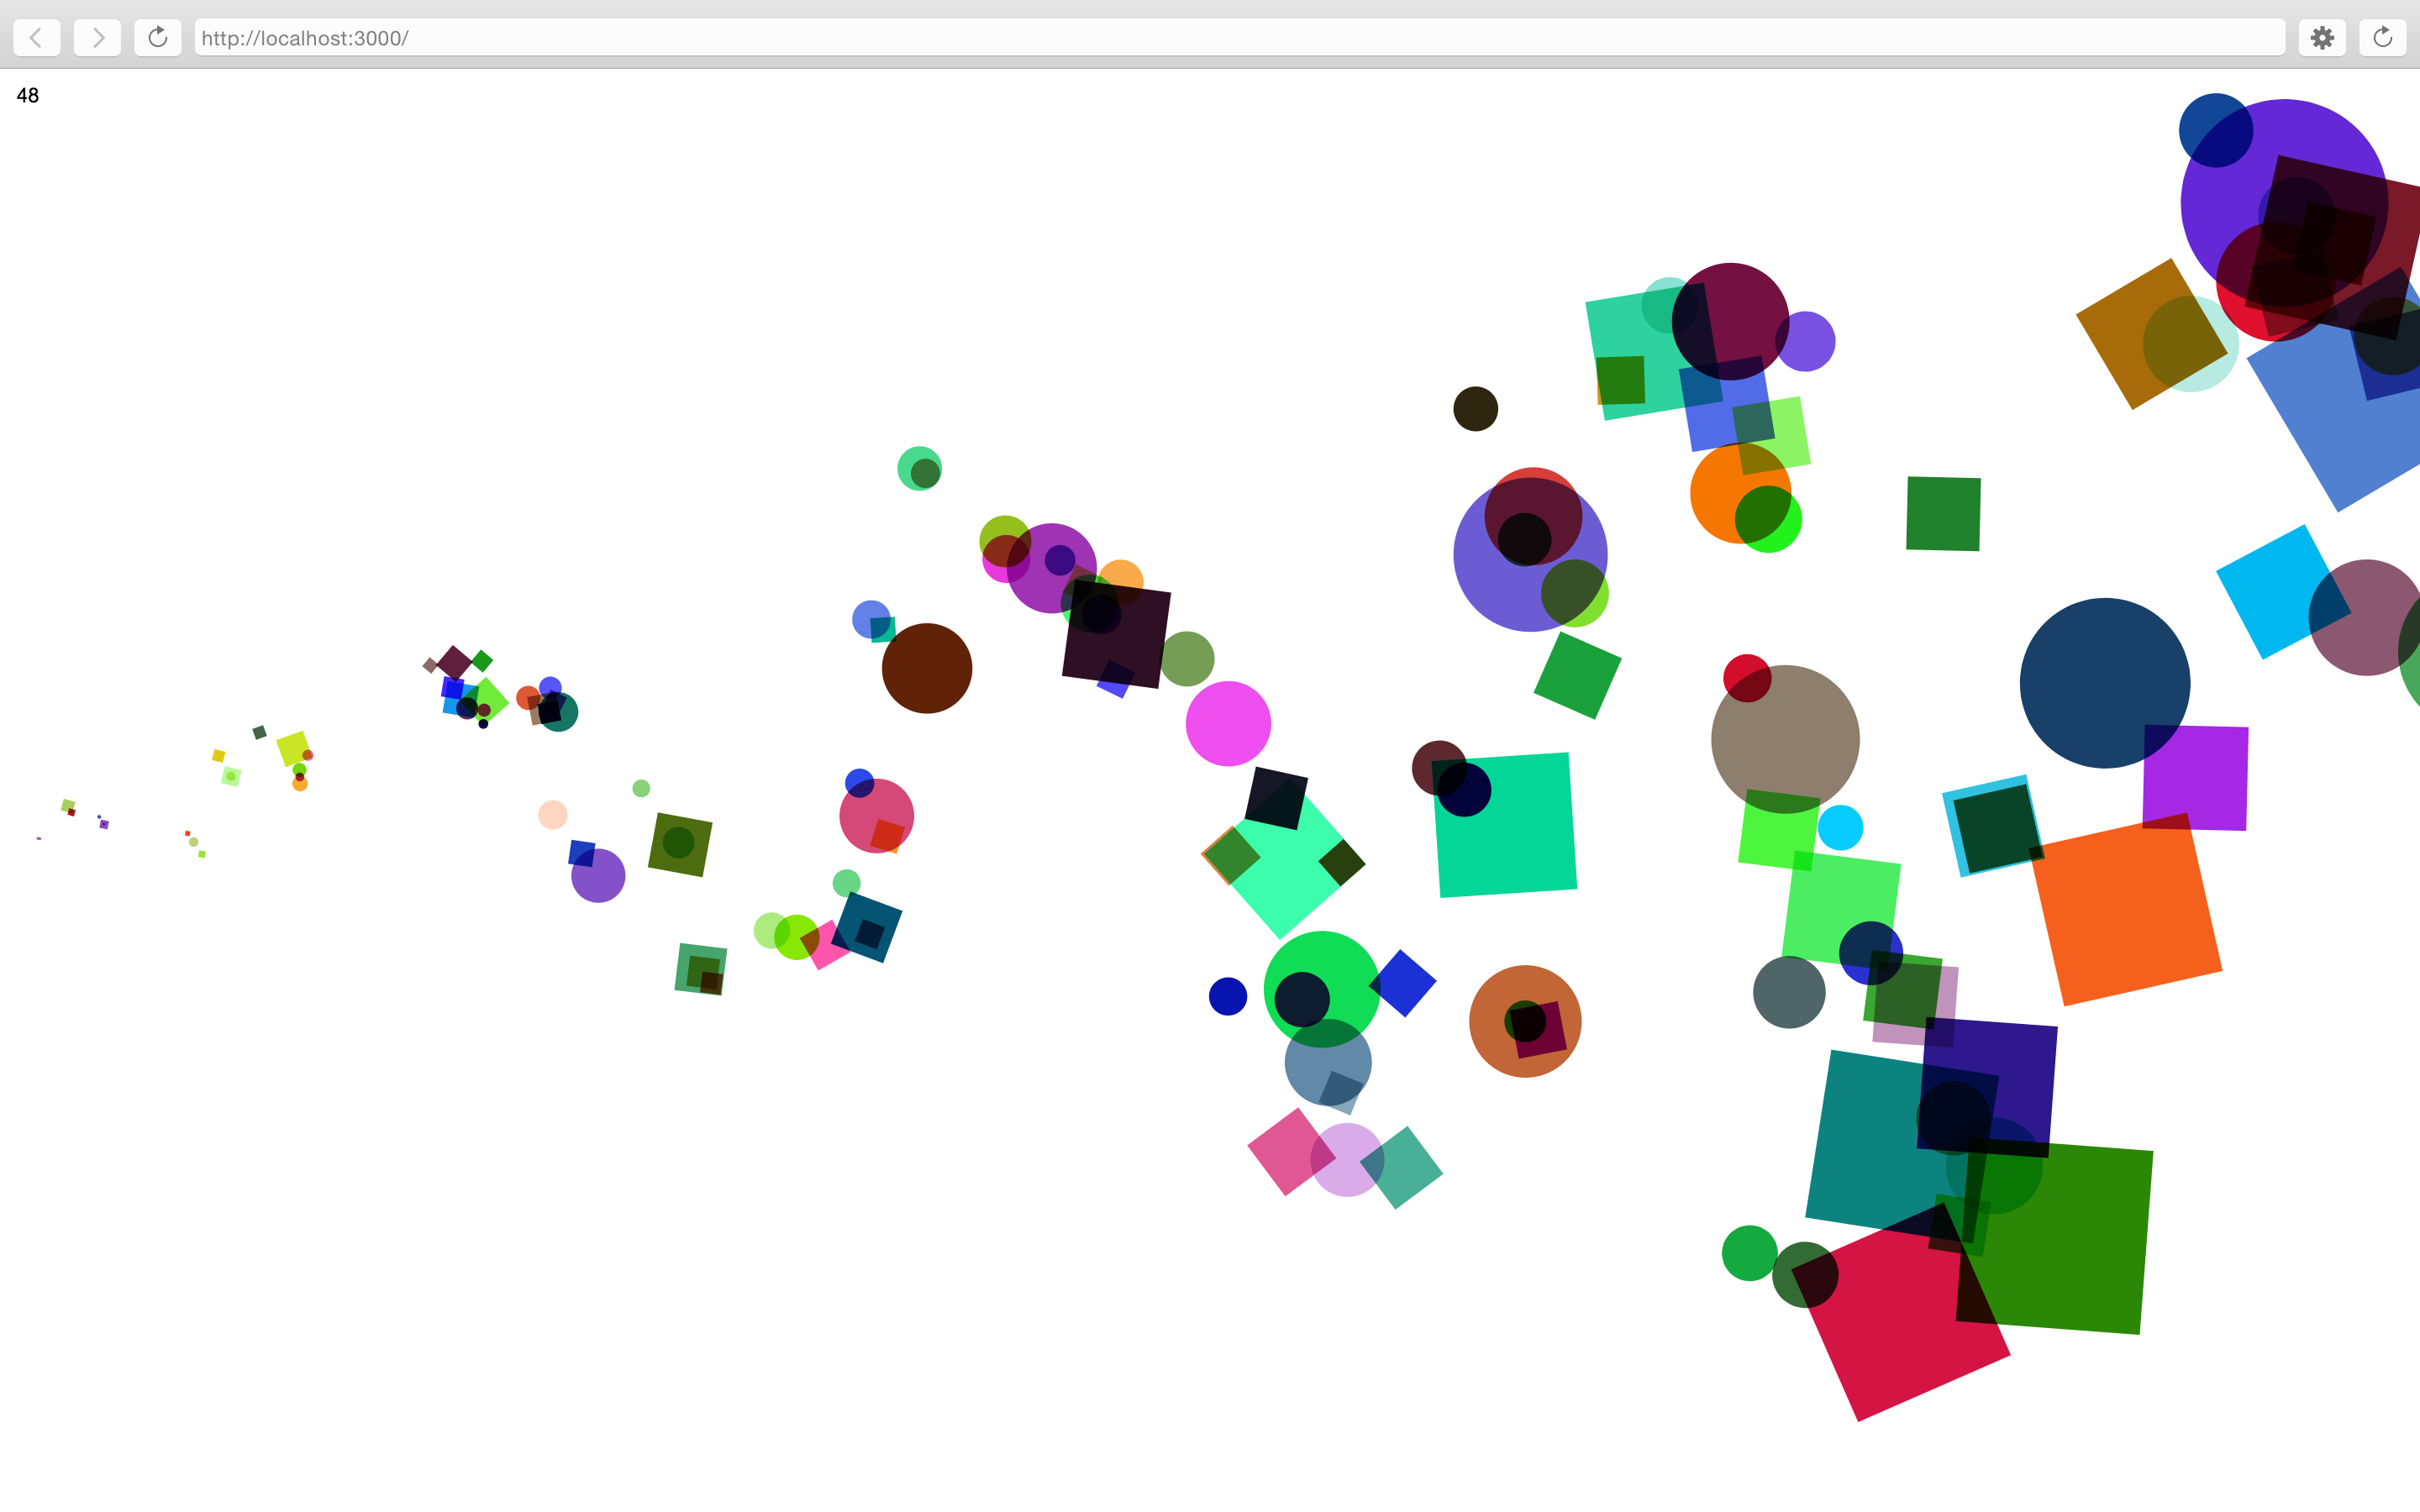
Then we built two particle systems from scratch, which was something I was very glad to get some help on. The system uses sine functions to create a pleasing flowing motion.
10/15/15
Class covered a lot of useful stuff. Preload for images. Callbacks. Load strings. Load from spreadsheets.
Brand new batch of acronyms:
CSV – comma separated values
TSV – tab separated values
JSON – java script object notation
API – application programming interface
Learned methods for inserting data into p5 sketches from website APIs. Although with each website using a slightly different API and some requiring keys I predict that it will take some time to make things work right.
10/14/15
Here is the latest thing I have been working on. I added a fancy background slideshow to the HTML code and used sliders in place of the potentiometers.
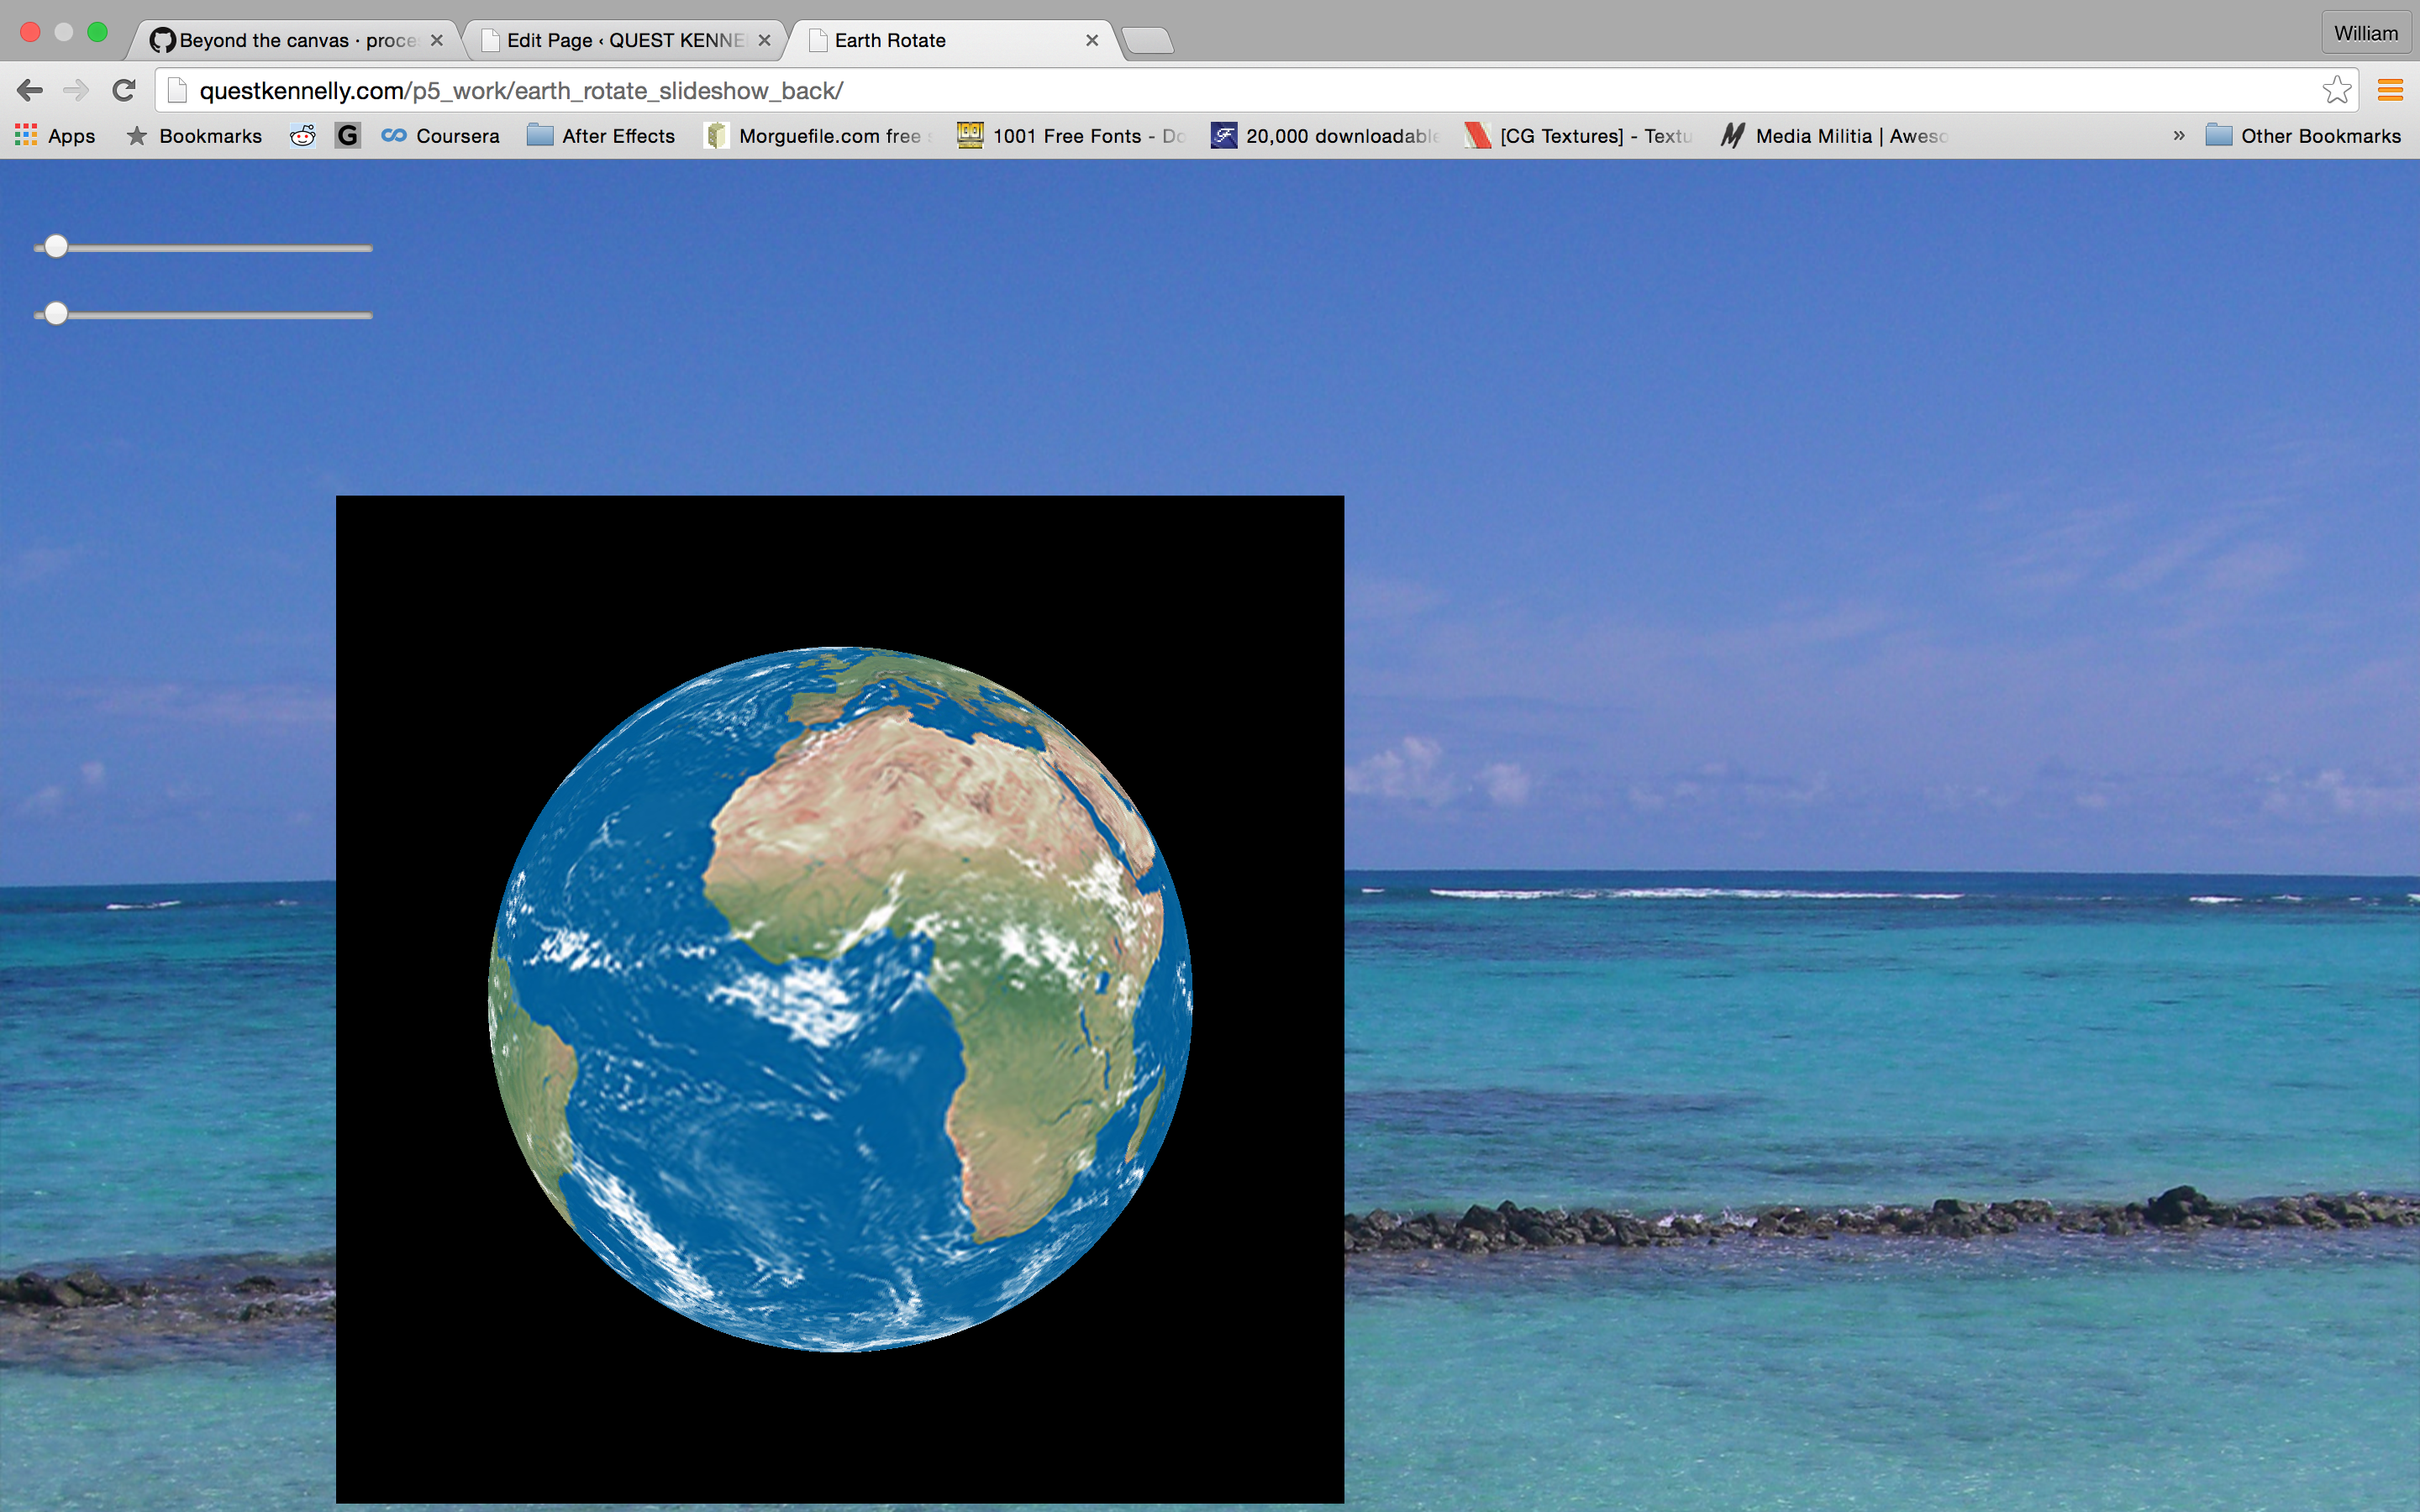
Earth Rotate with Slideshow background
I struggled a bit with getting the arduino board analog inputs and P5 to play nice. It took a while to get it working with on potentiometer but I eventually got the globe to orbit in the X and Y axes with input from two potentiometers.
10/13/15
I was able to create an earth globe with the webgl sphere element and the texture function.
Unfortunately the normal mapping on the sphere is broken. notice how the grid distorts at the seam and the poles in these tests:
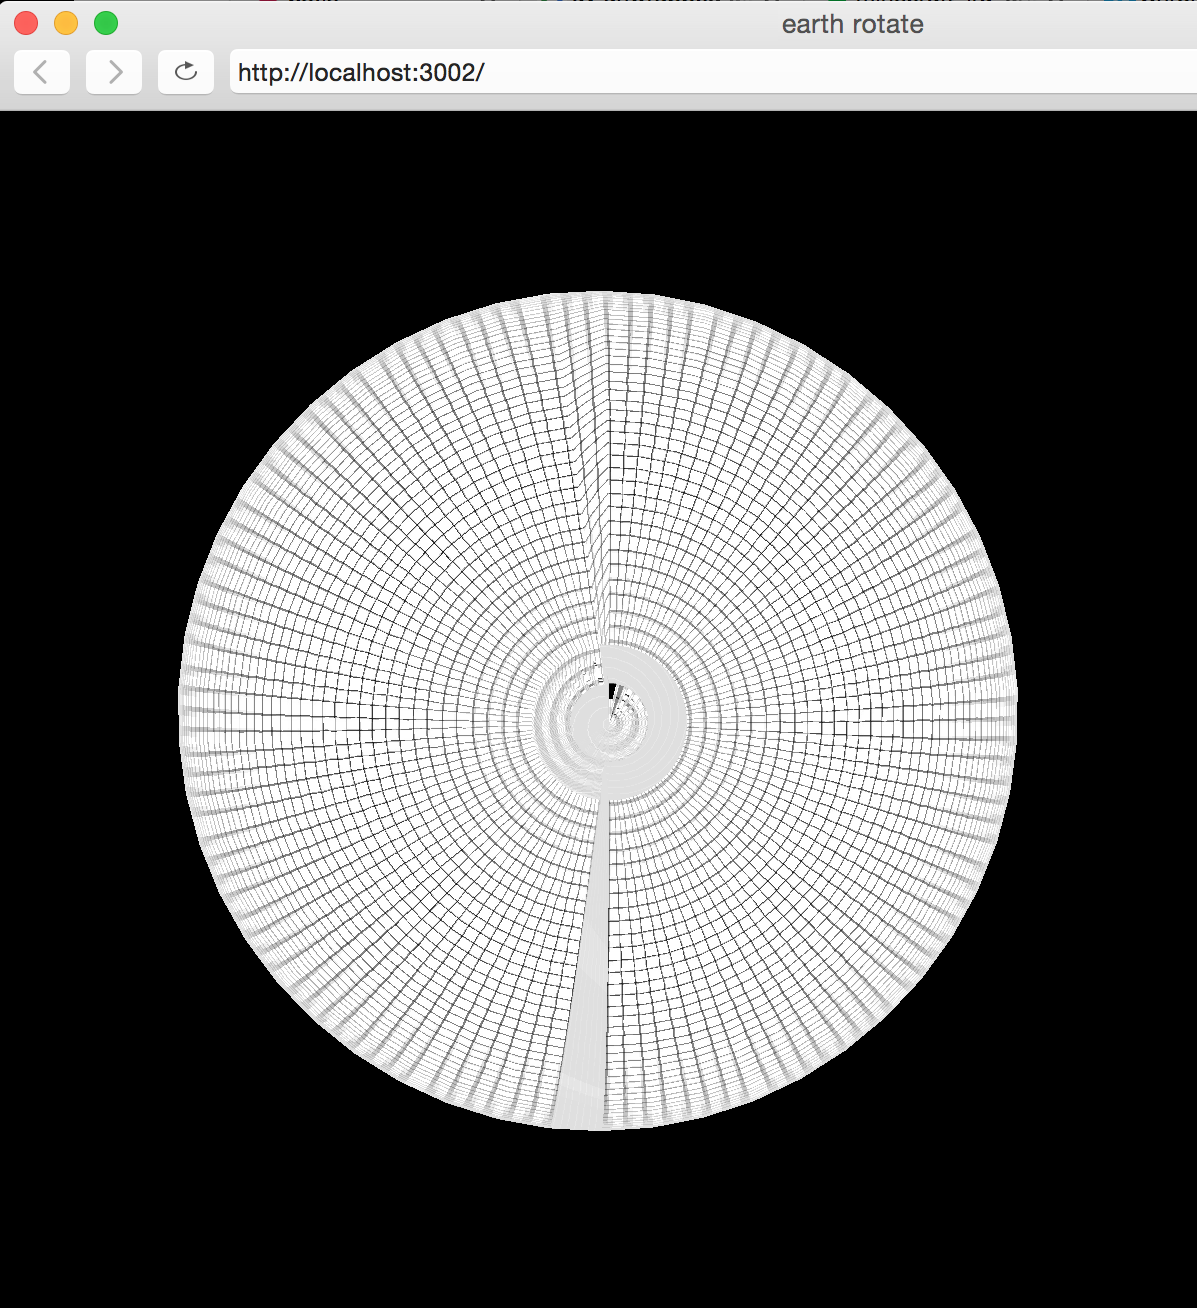
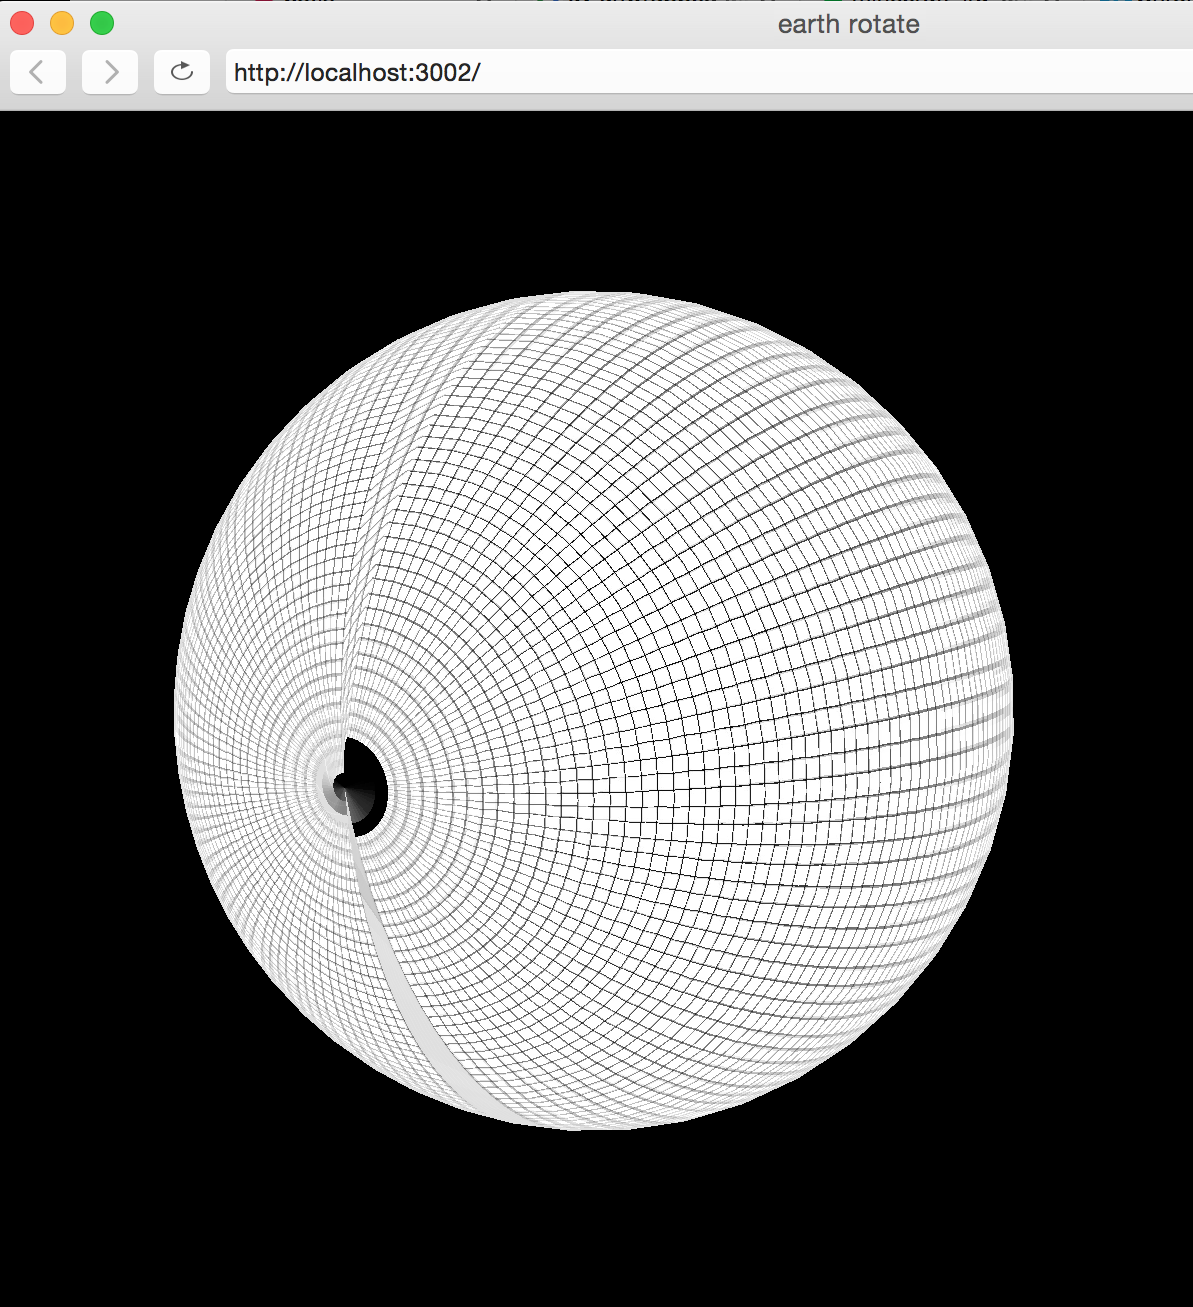
If the normals were properly laid out the mesh would have a clean seam. I submitted a note to the p5 development github page so hopefully it will be fixed soon.
10/12/15
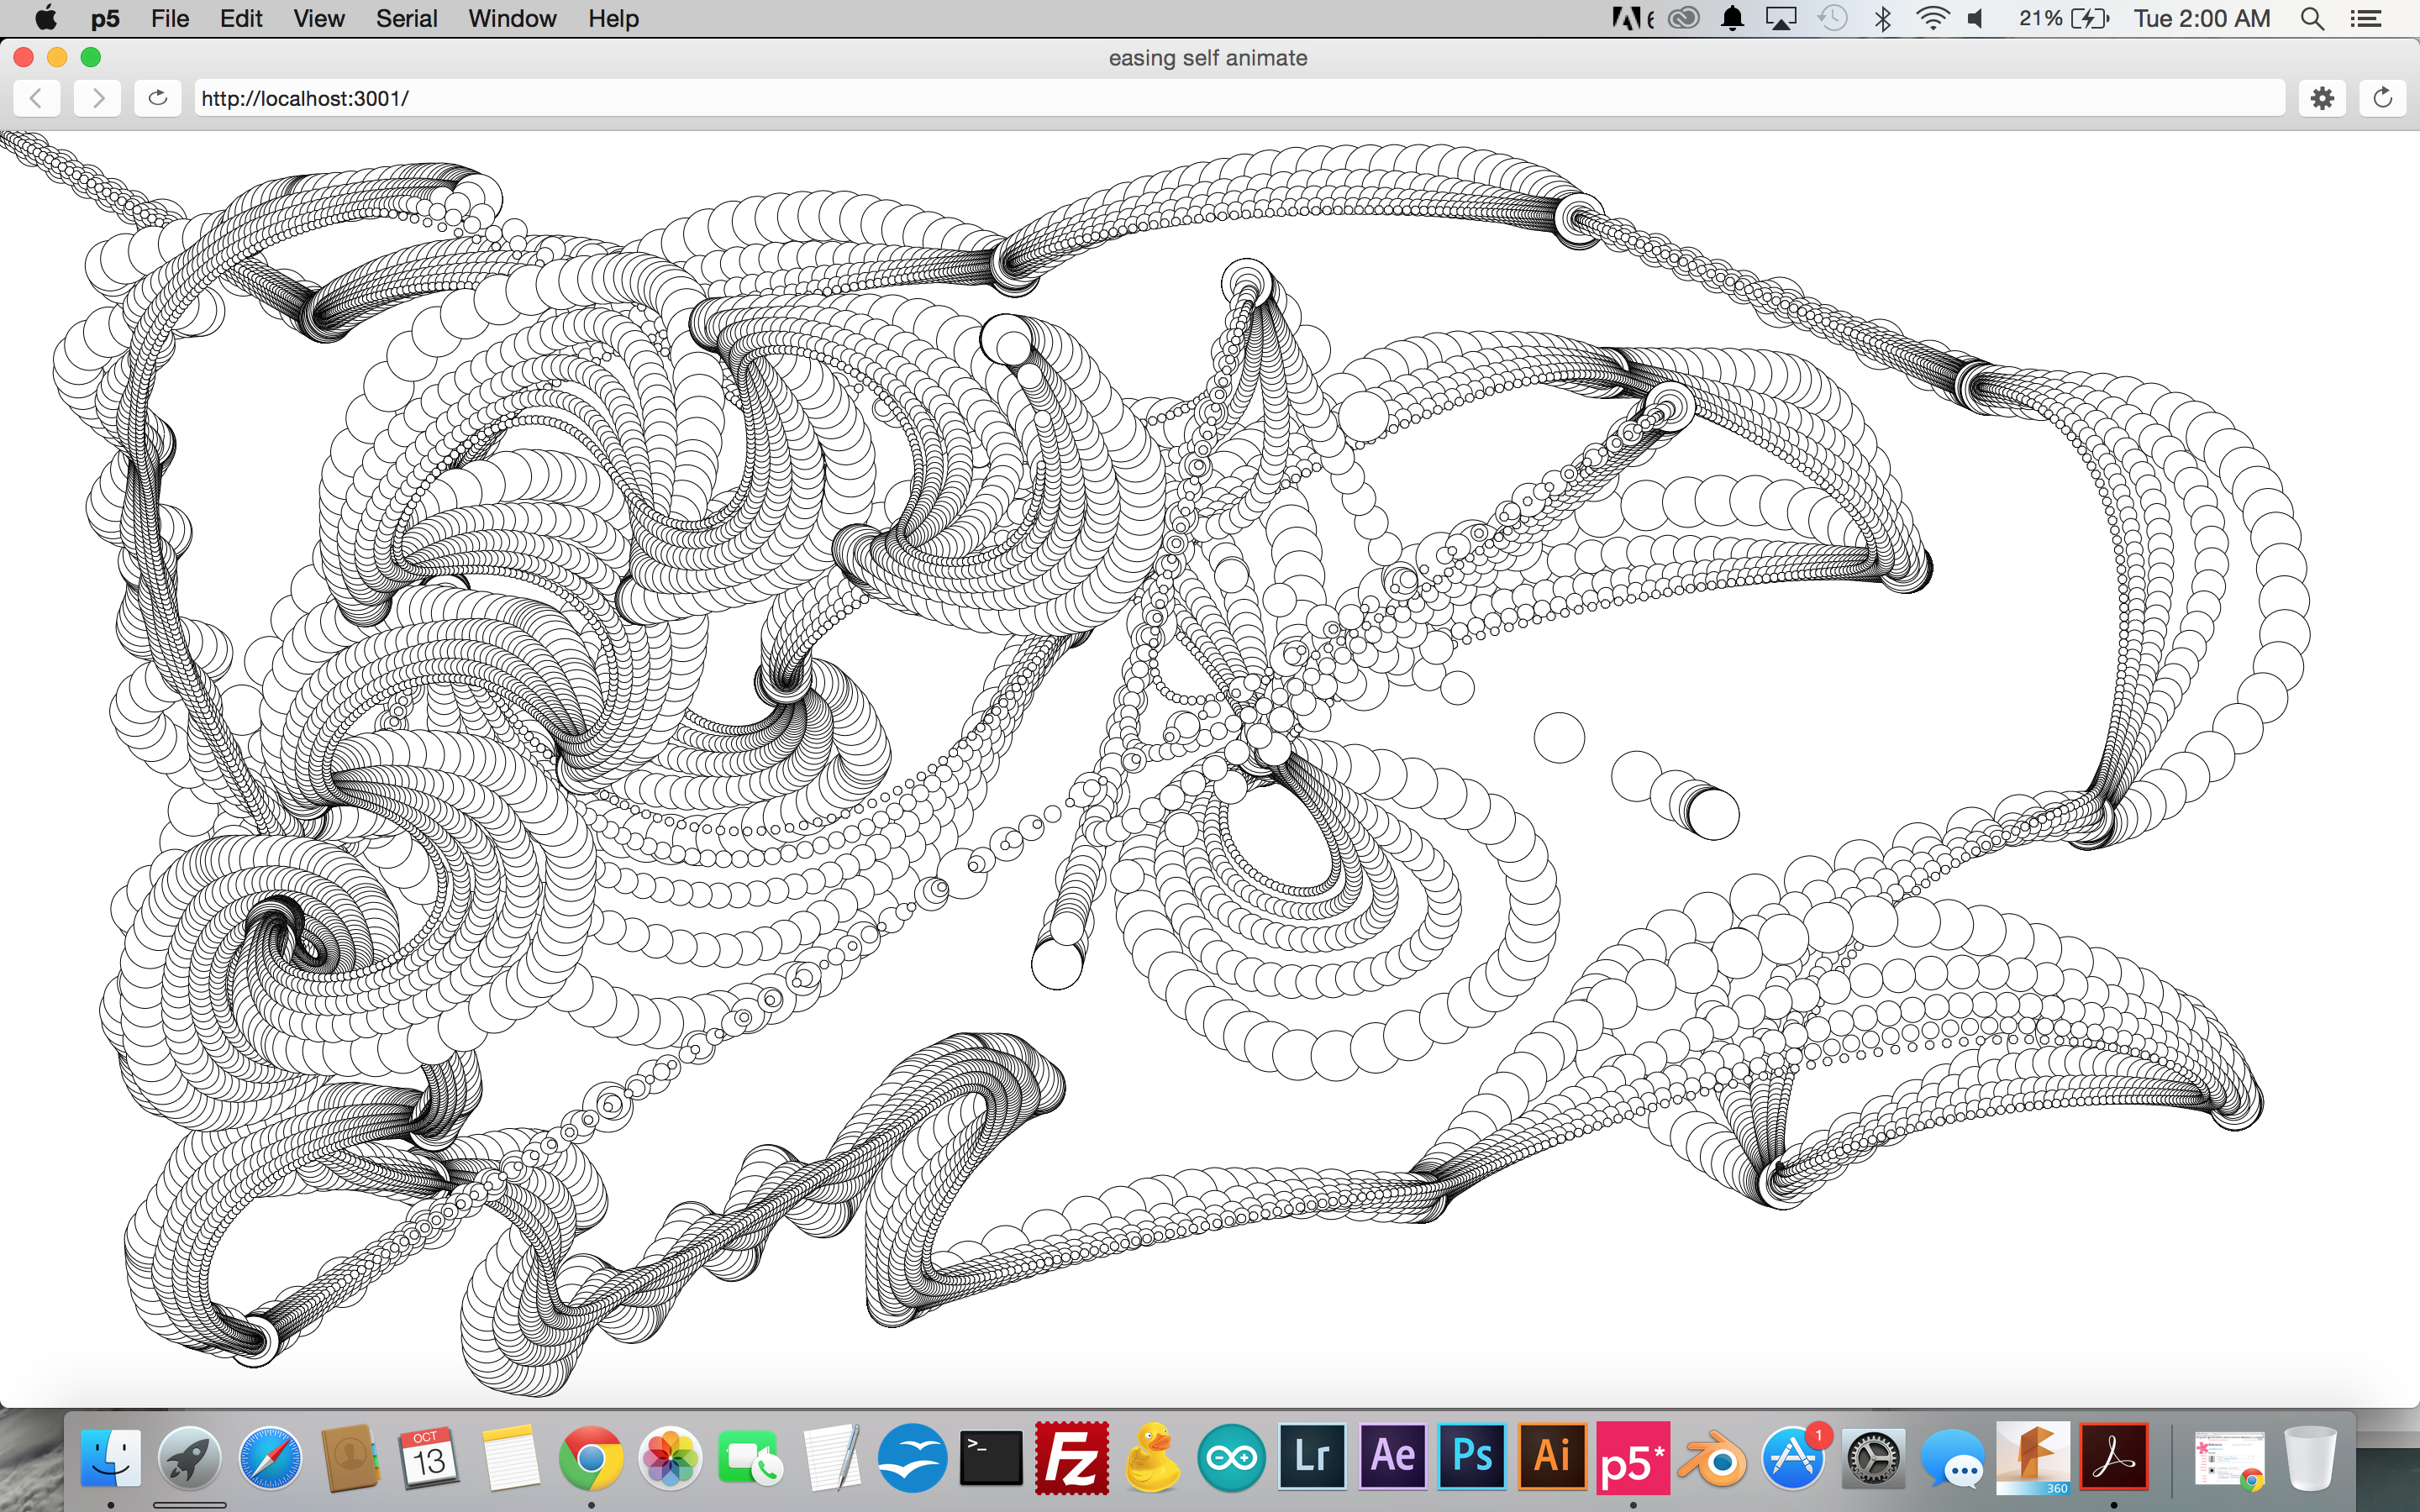
Fun with multiple easing objects following the mouse.
10/8/15
Covered in class today we looked at how the p5 canvas sits on a regular old html page which means we can manipulate how it displays, where it loads and make it interact with html code as well as CSS. Also introduced today, something I am very excited about: 3D shapes! I can’t wait for the addition of 3D mesh import. I can think of lots of fun ways to bring my expertise in 3D modeling and texturing into play. I have been looking at webGL experiments lately and I am surprised by how sophisticated some of the work is. Now if it could only run without making my laptop hot and slow?
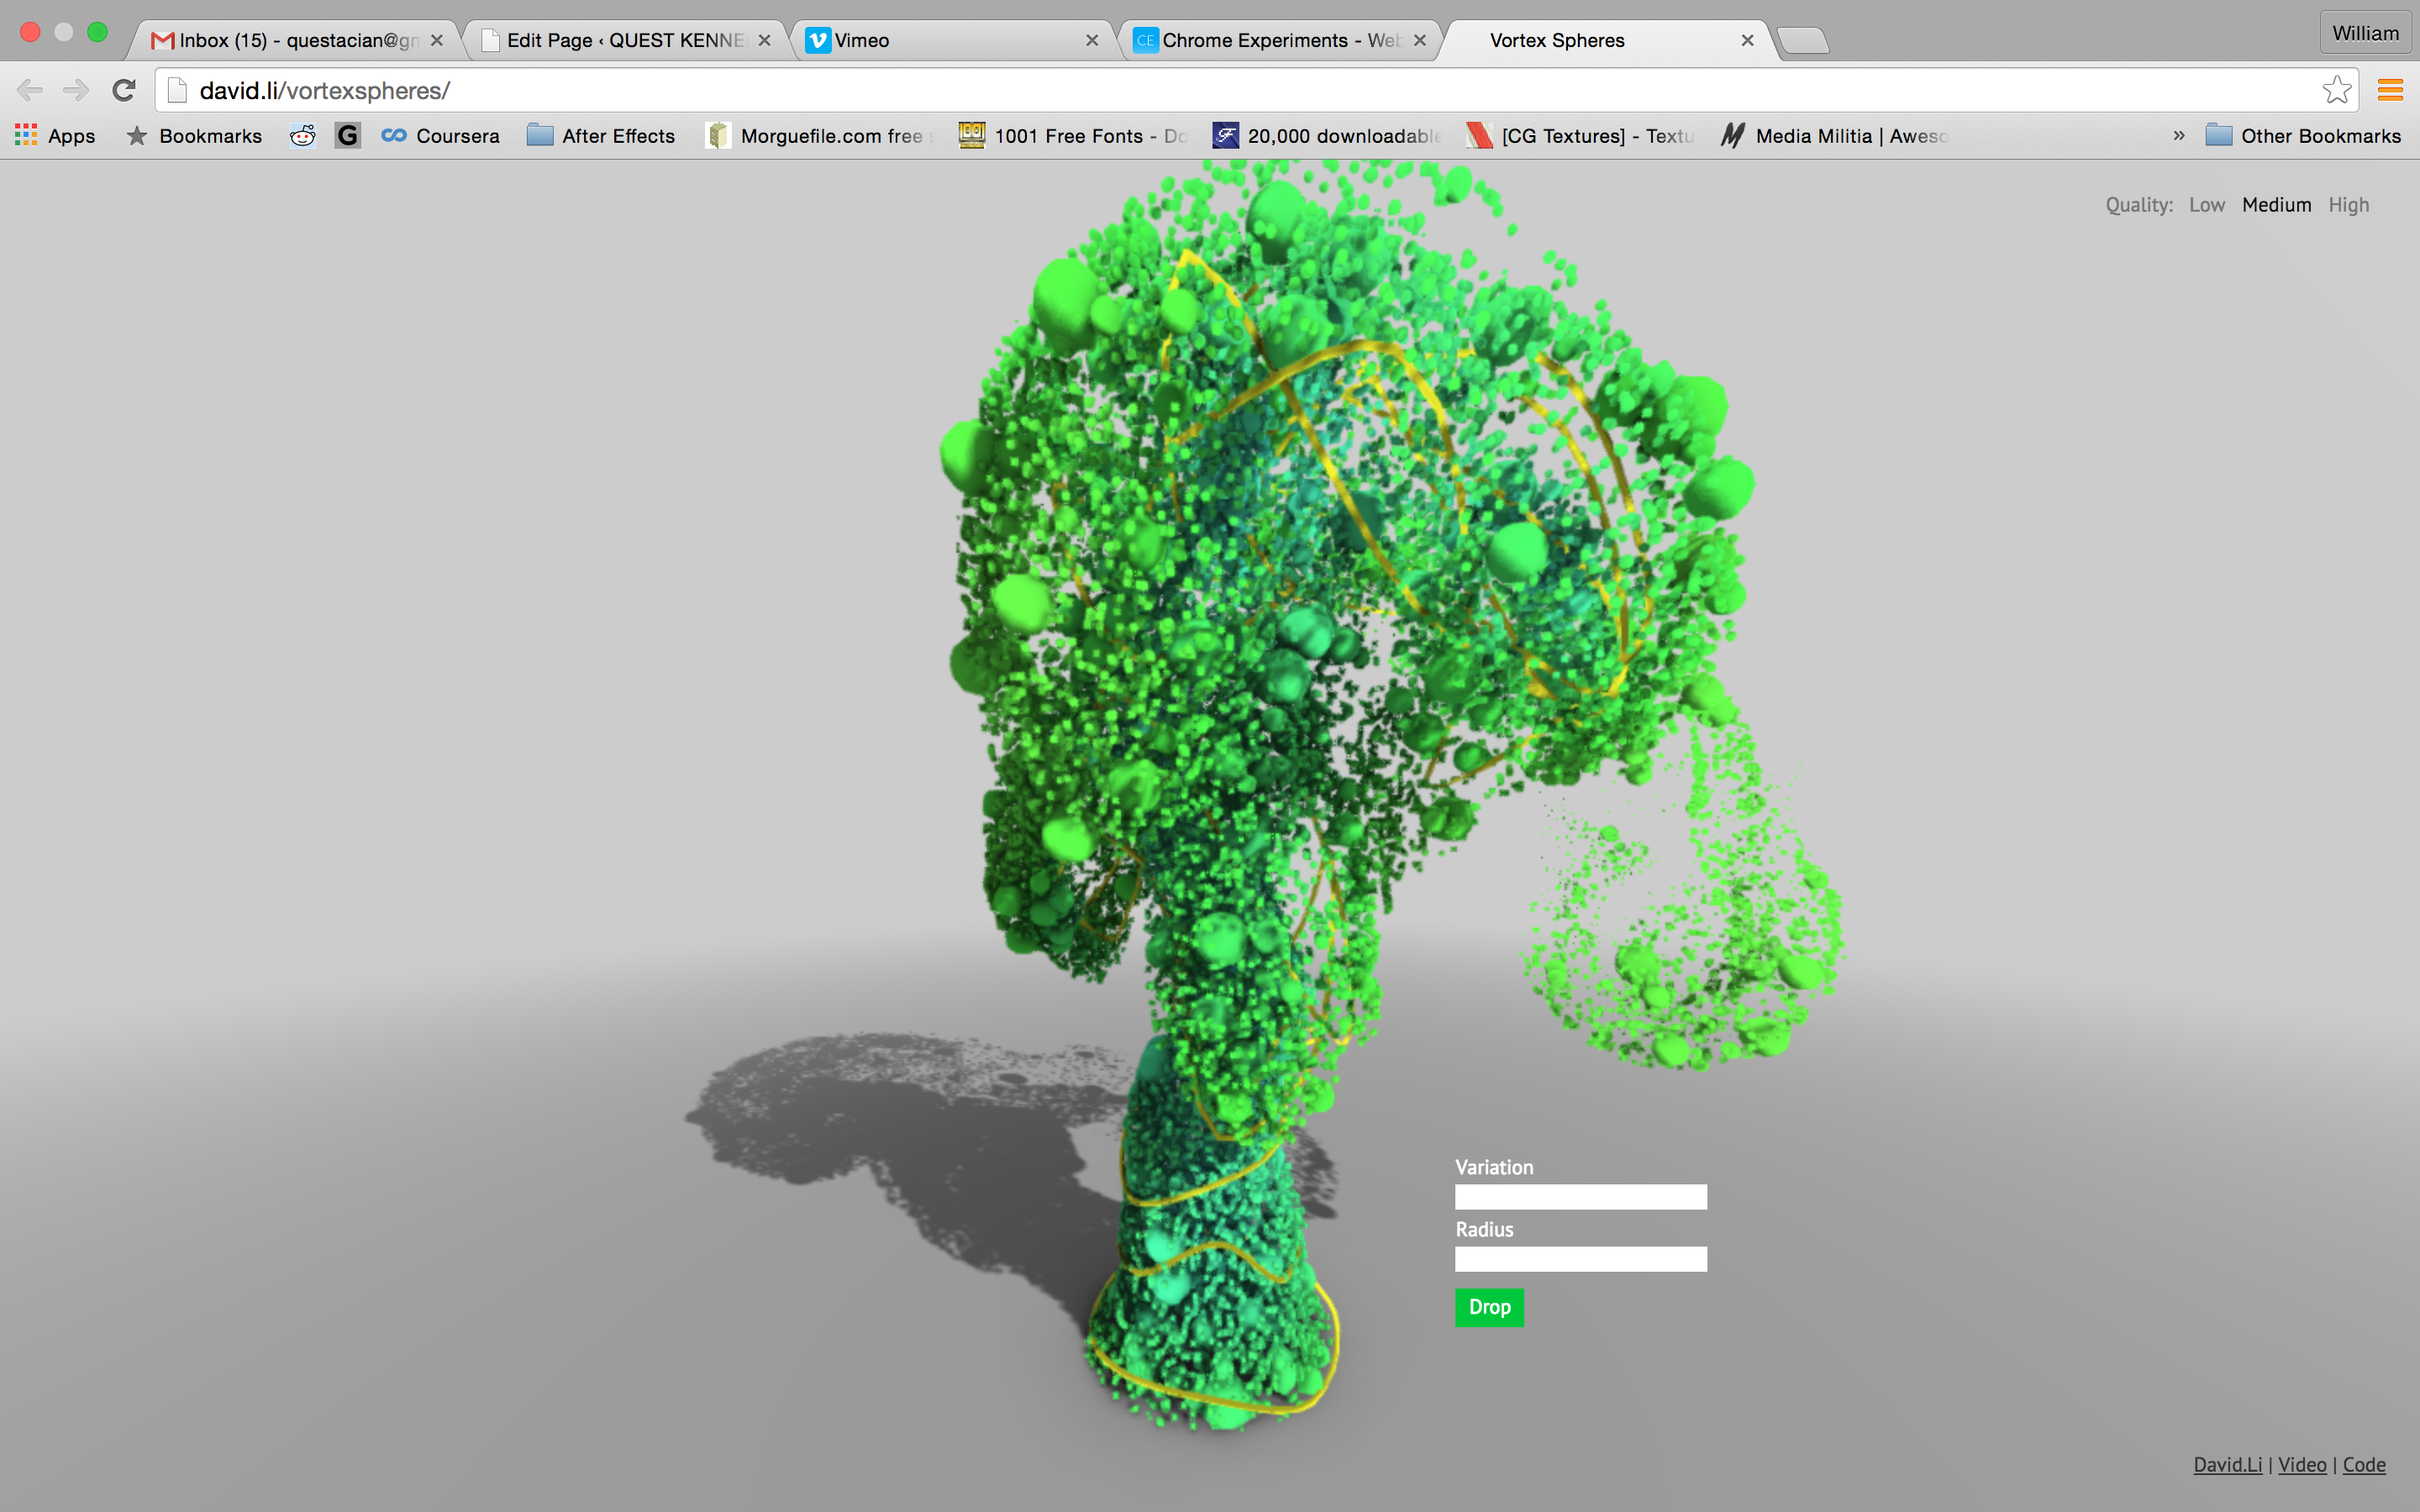
This page has some really cool webGL experiments:
Here is a snapshot of one of my favorites in action:
10/5/15
After more adjustments to it during the synthesis event I reworked the recursive tree maker to dynamically redraw with sliders for the angle inputs.
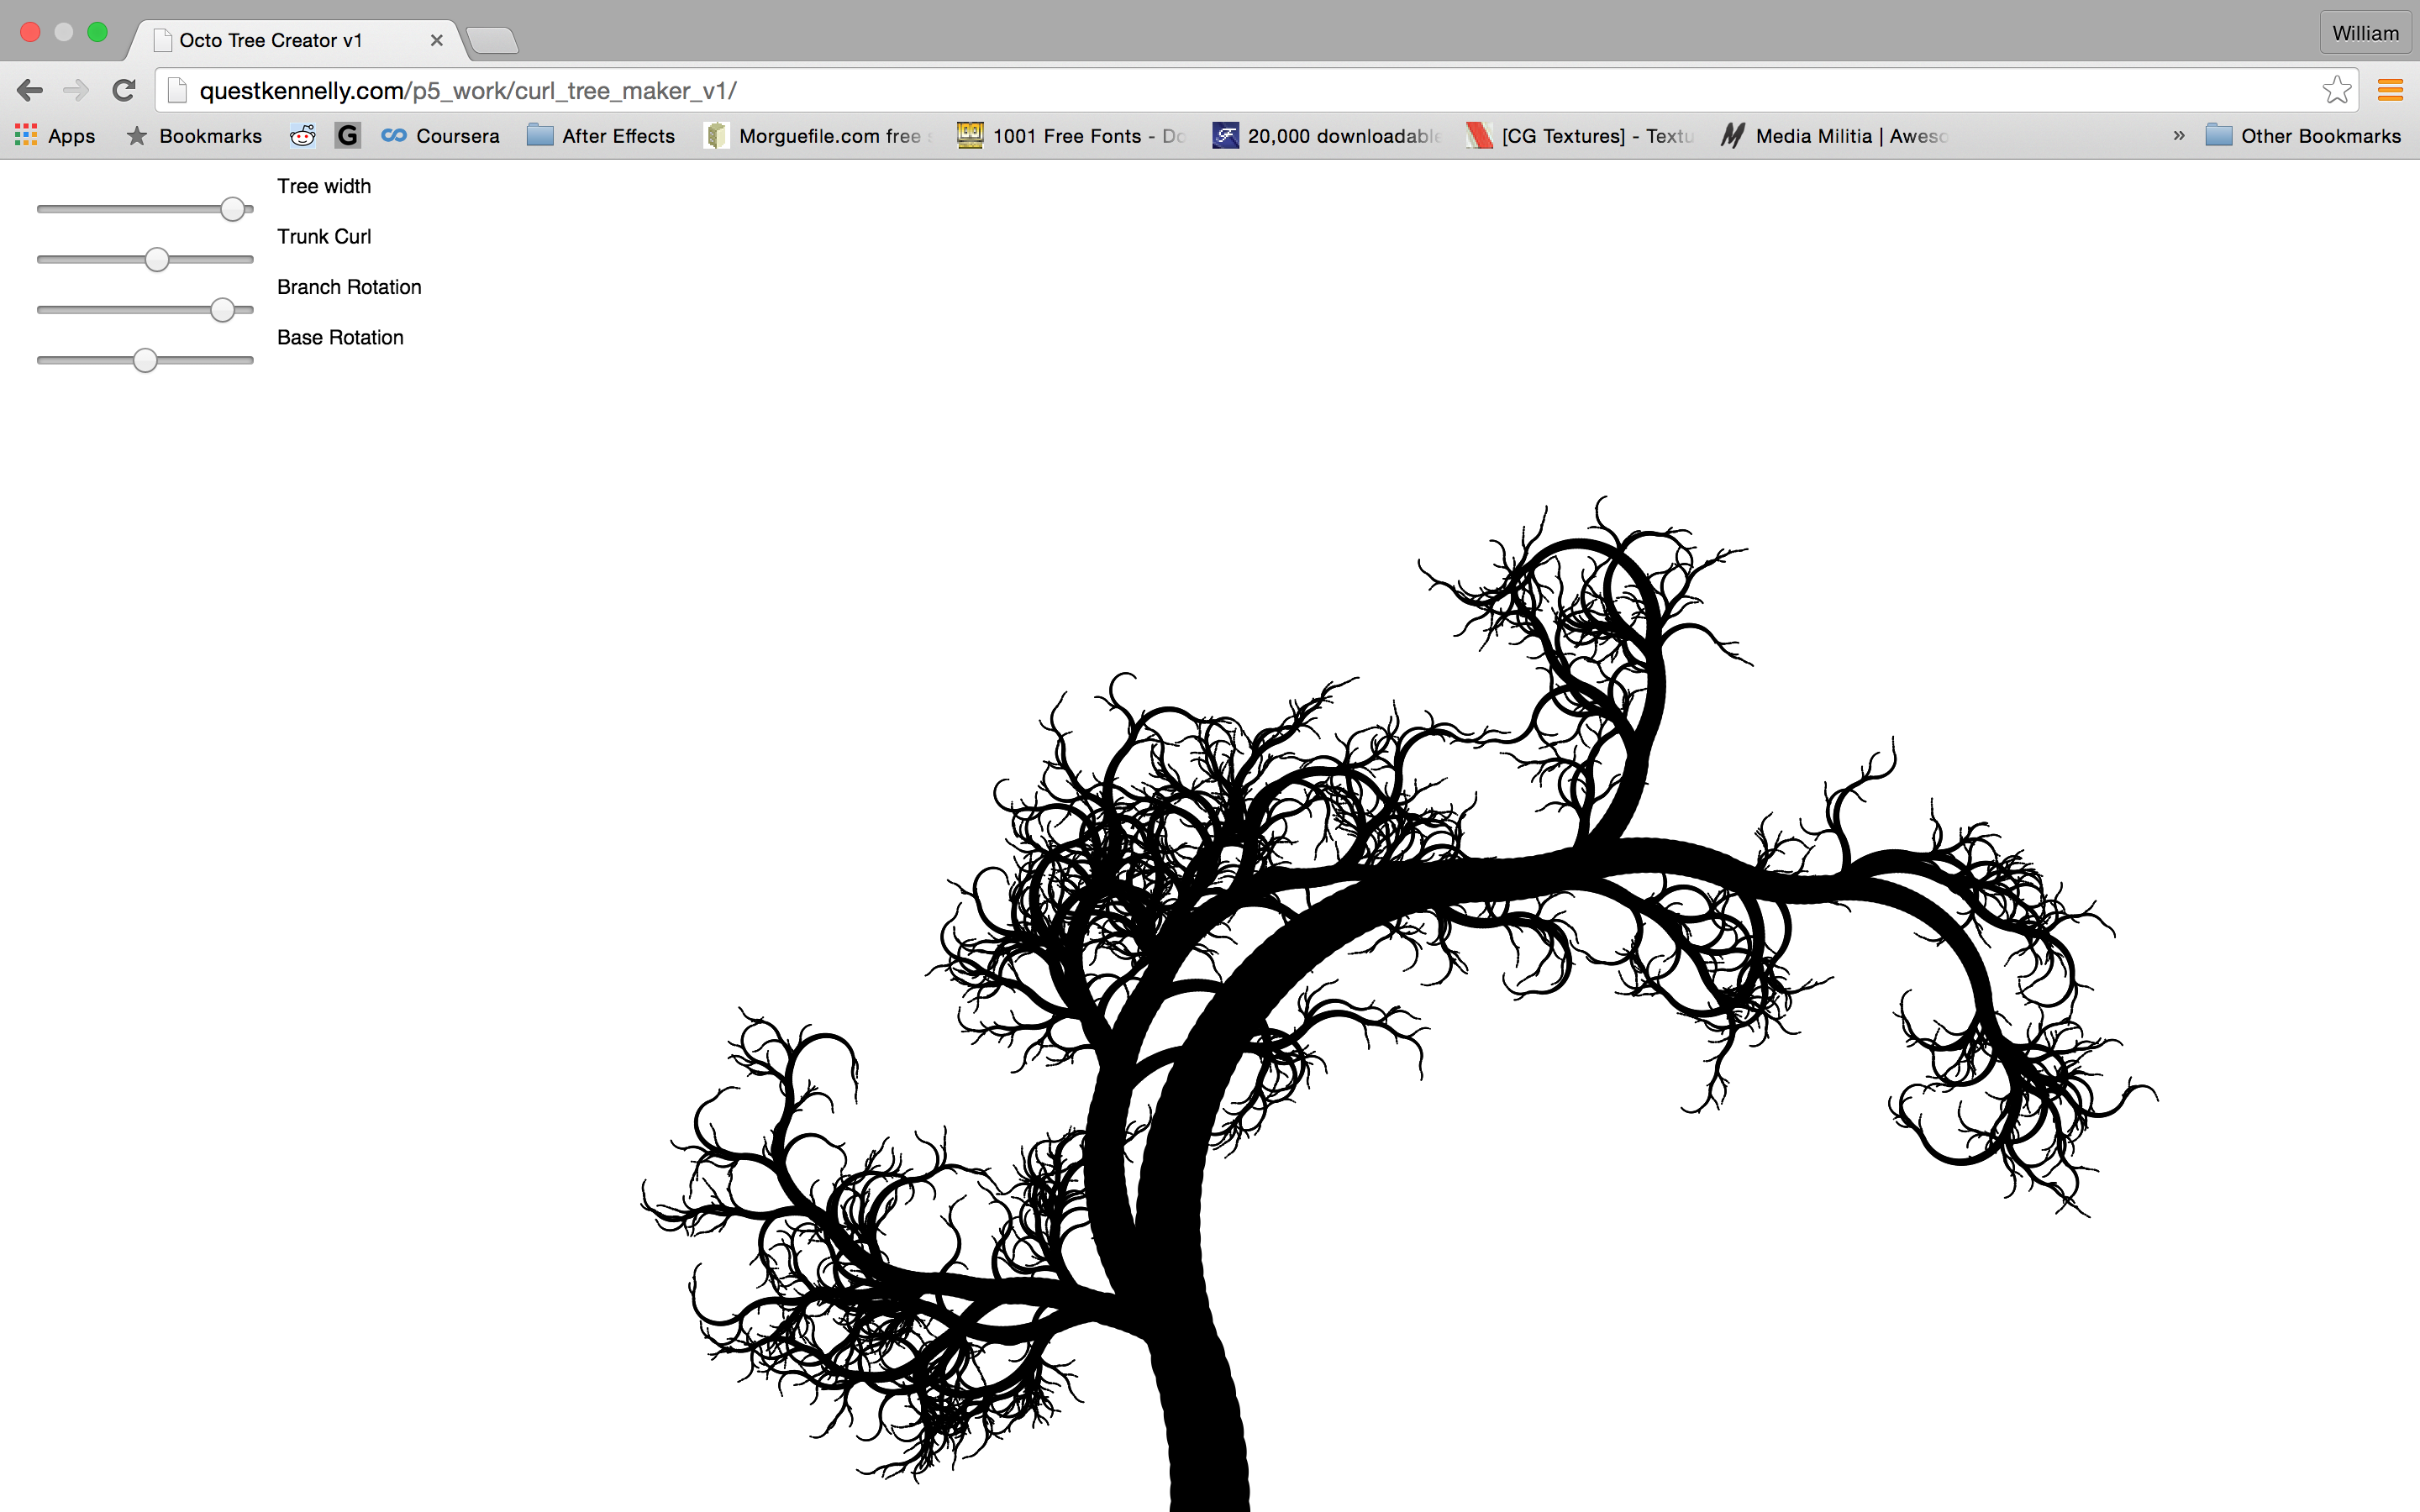
During Synthesis Nikita and I were able to get a potentiometer to control the angle settings for this recursive code that draws an organic, curly tree shape. Lots of noise in the signal but I think we can smooth it out later.
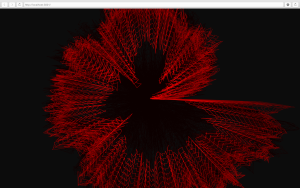
9/30/15
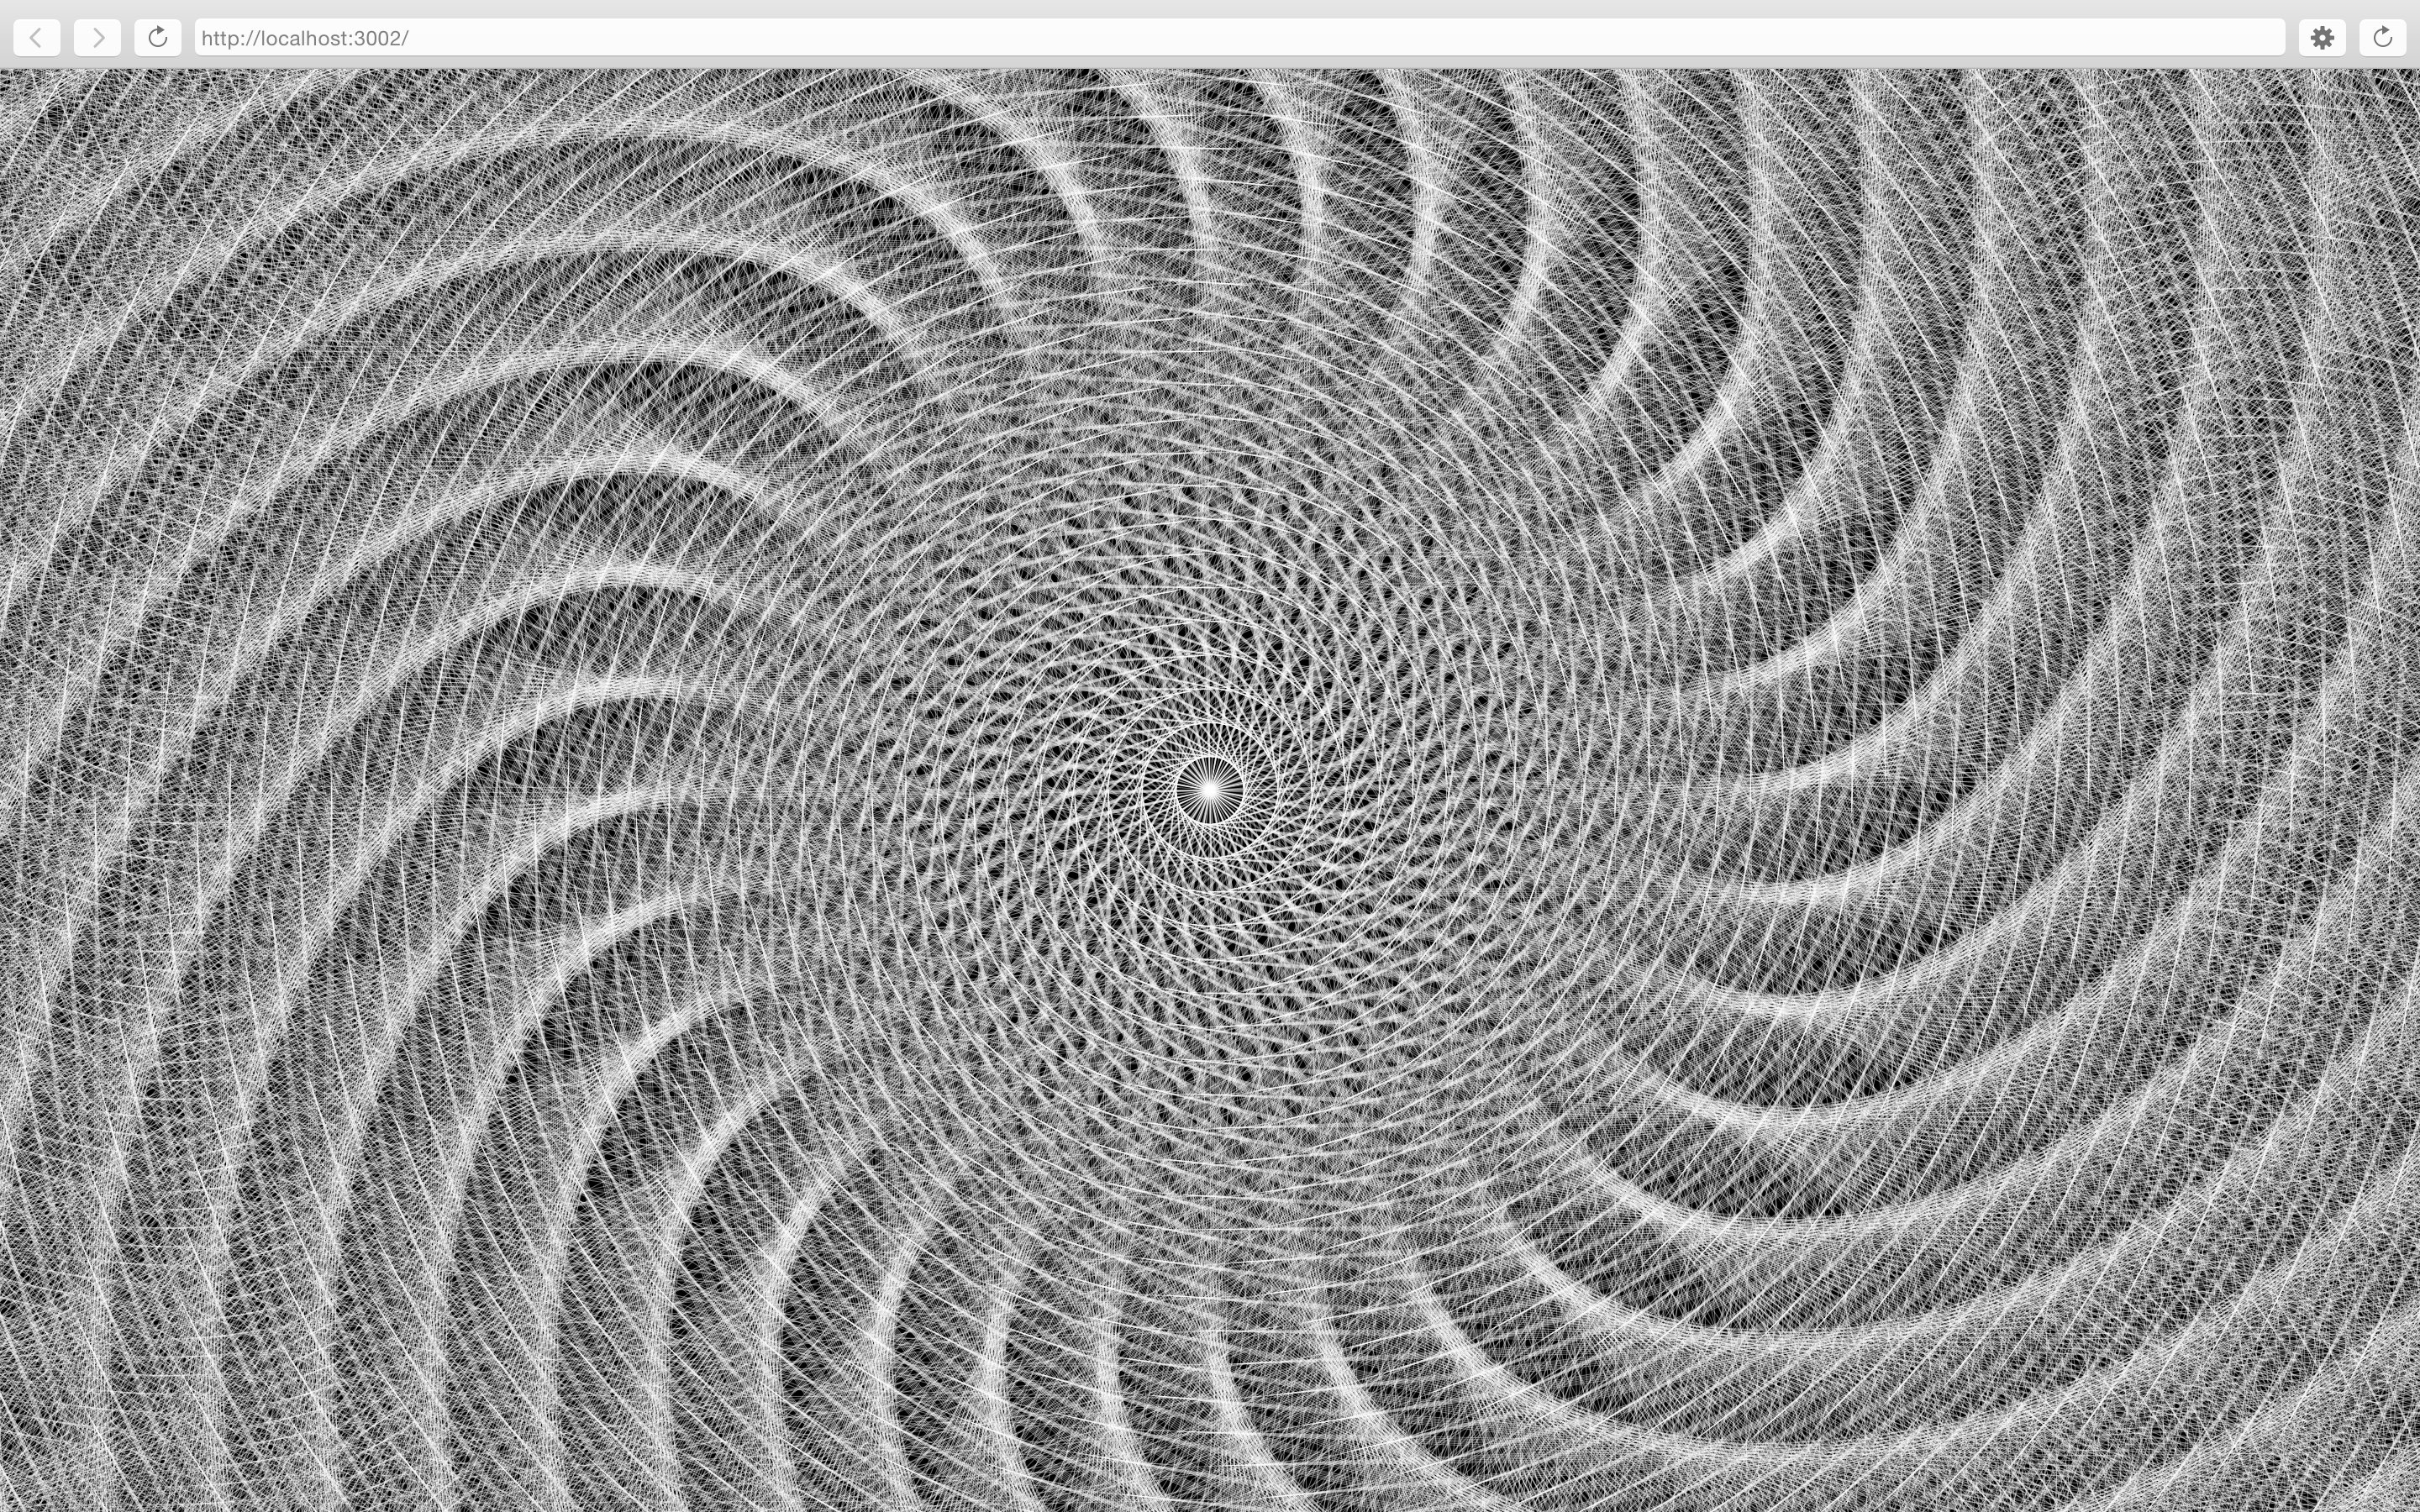
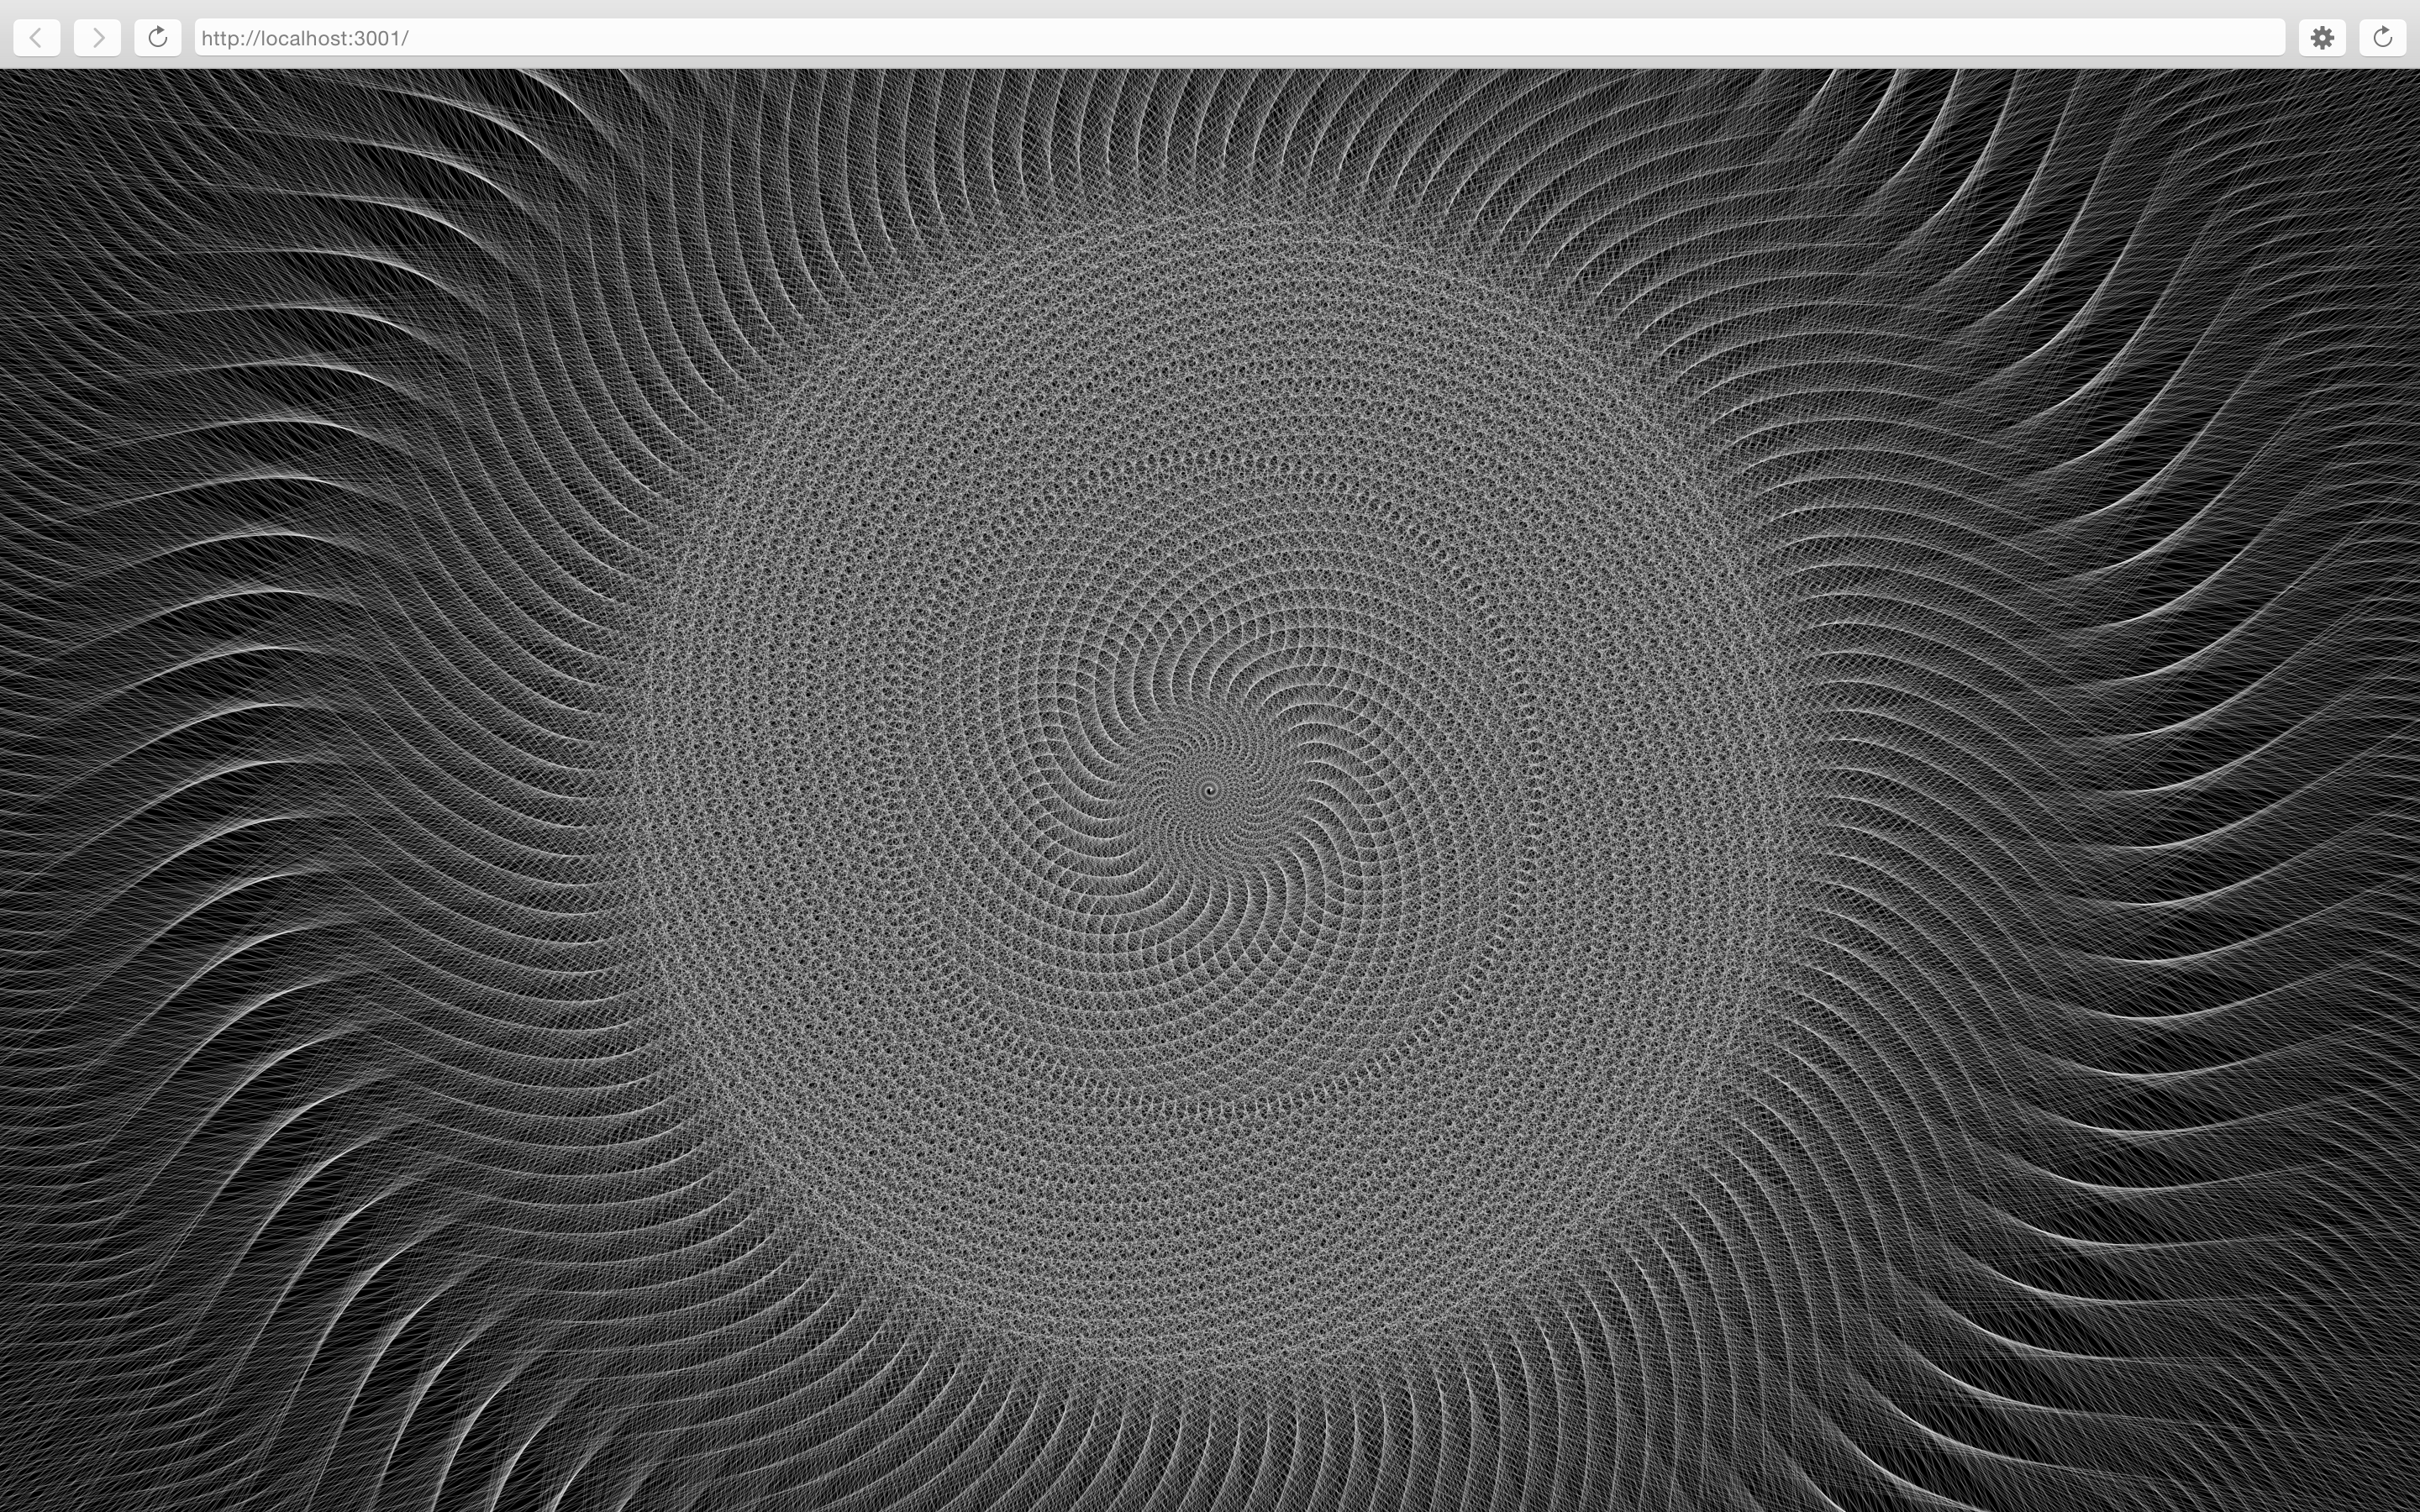
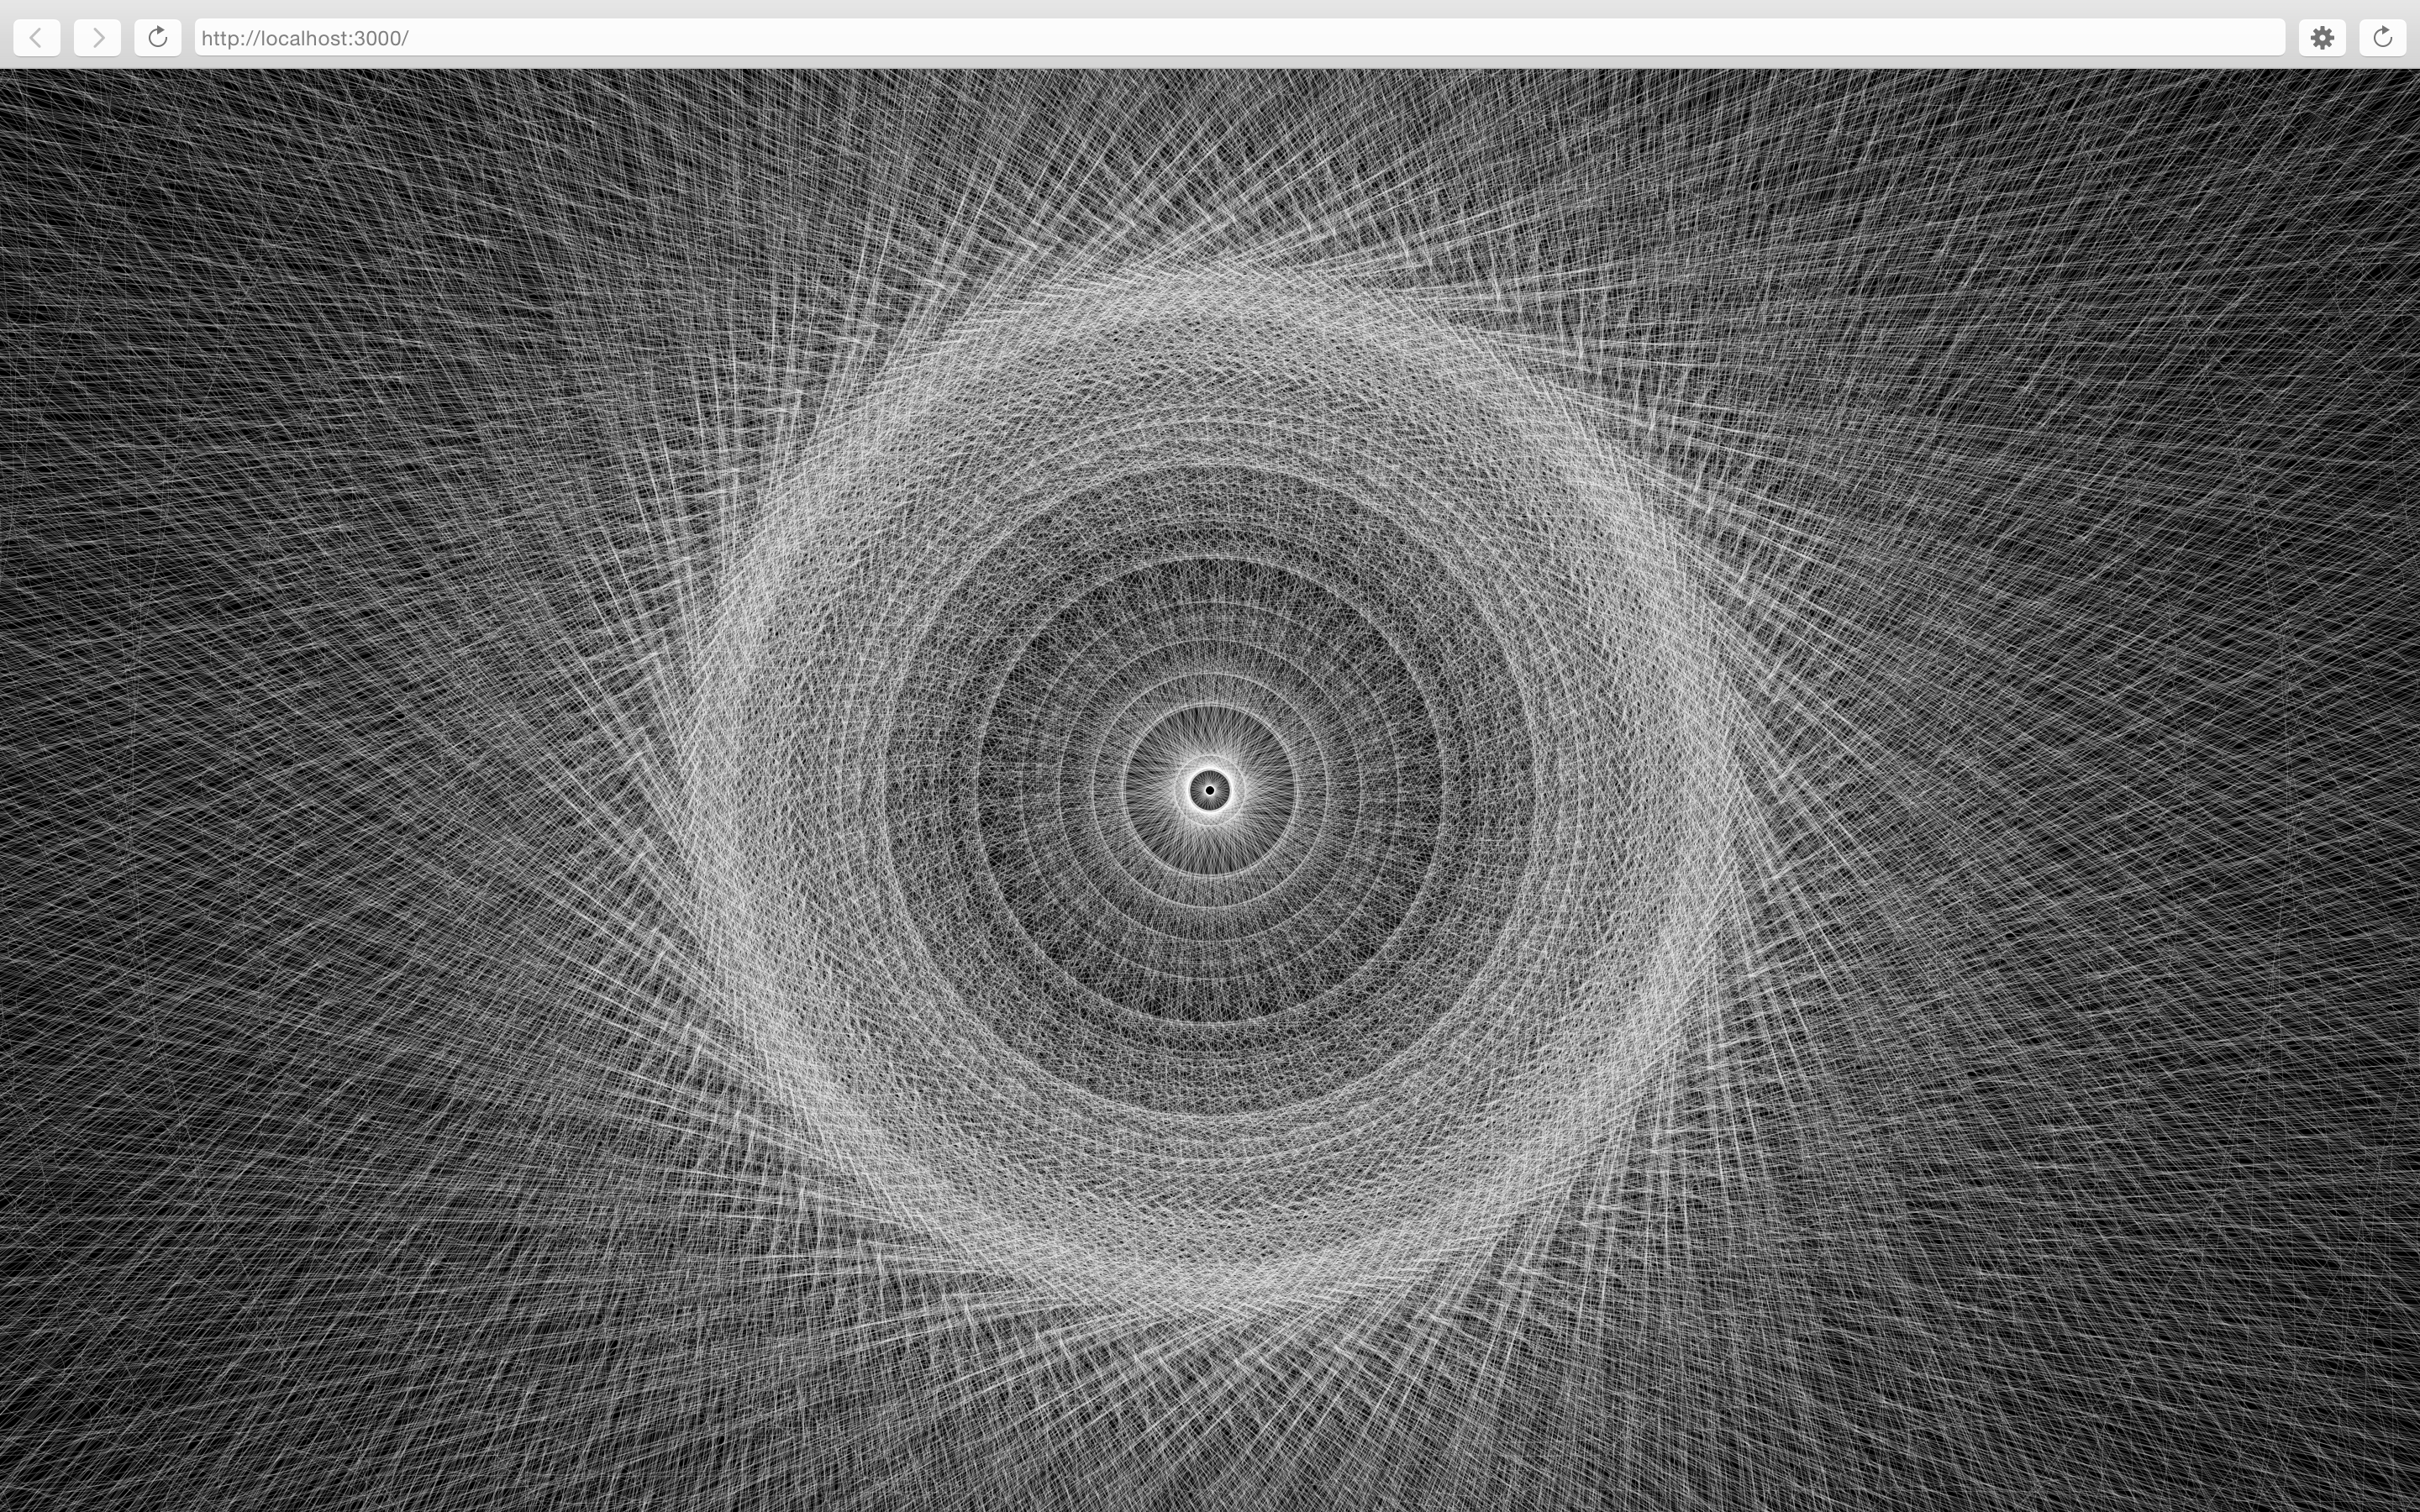
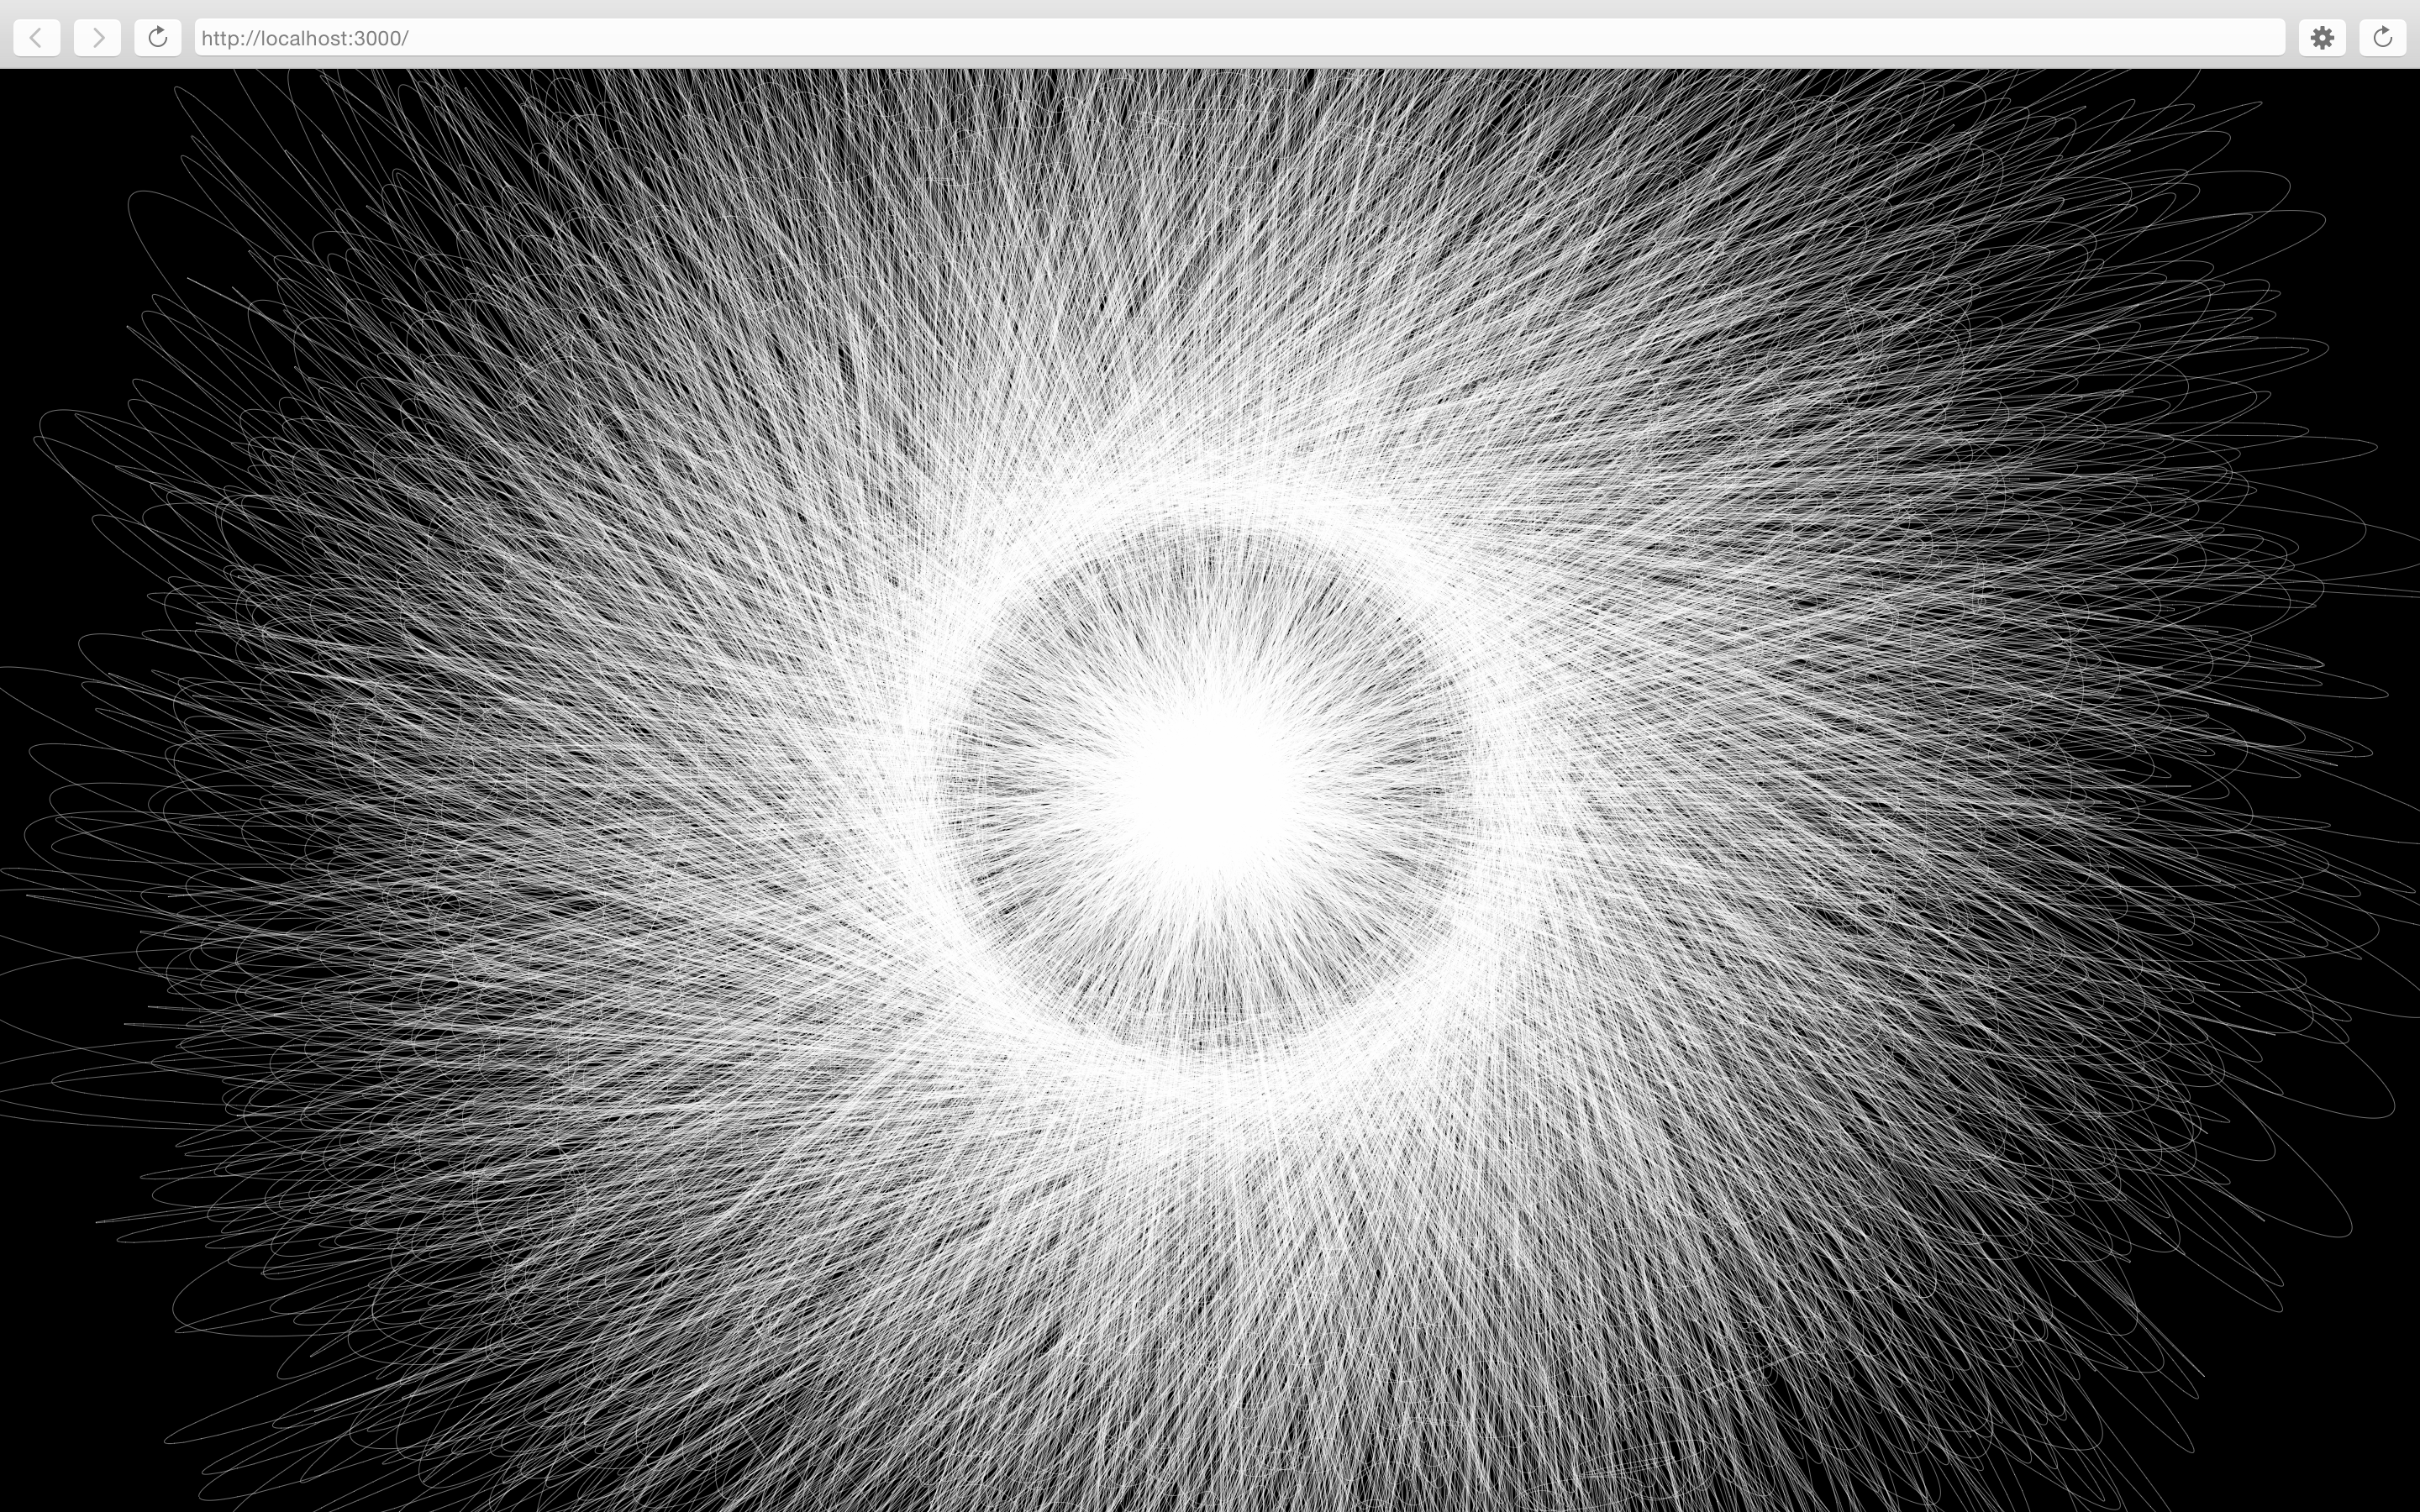
For this one I chopped up and remixed someone else’s code. I’m still figuring out how exactly it works. Heavy use of angles, sin, cos, etc.
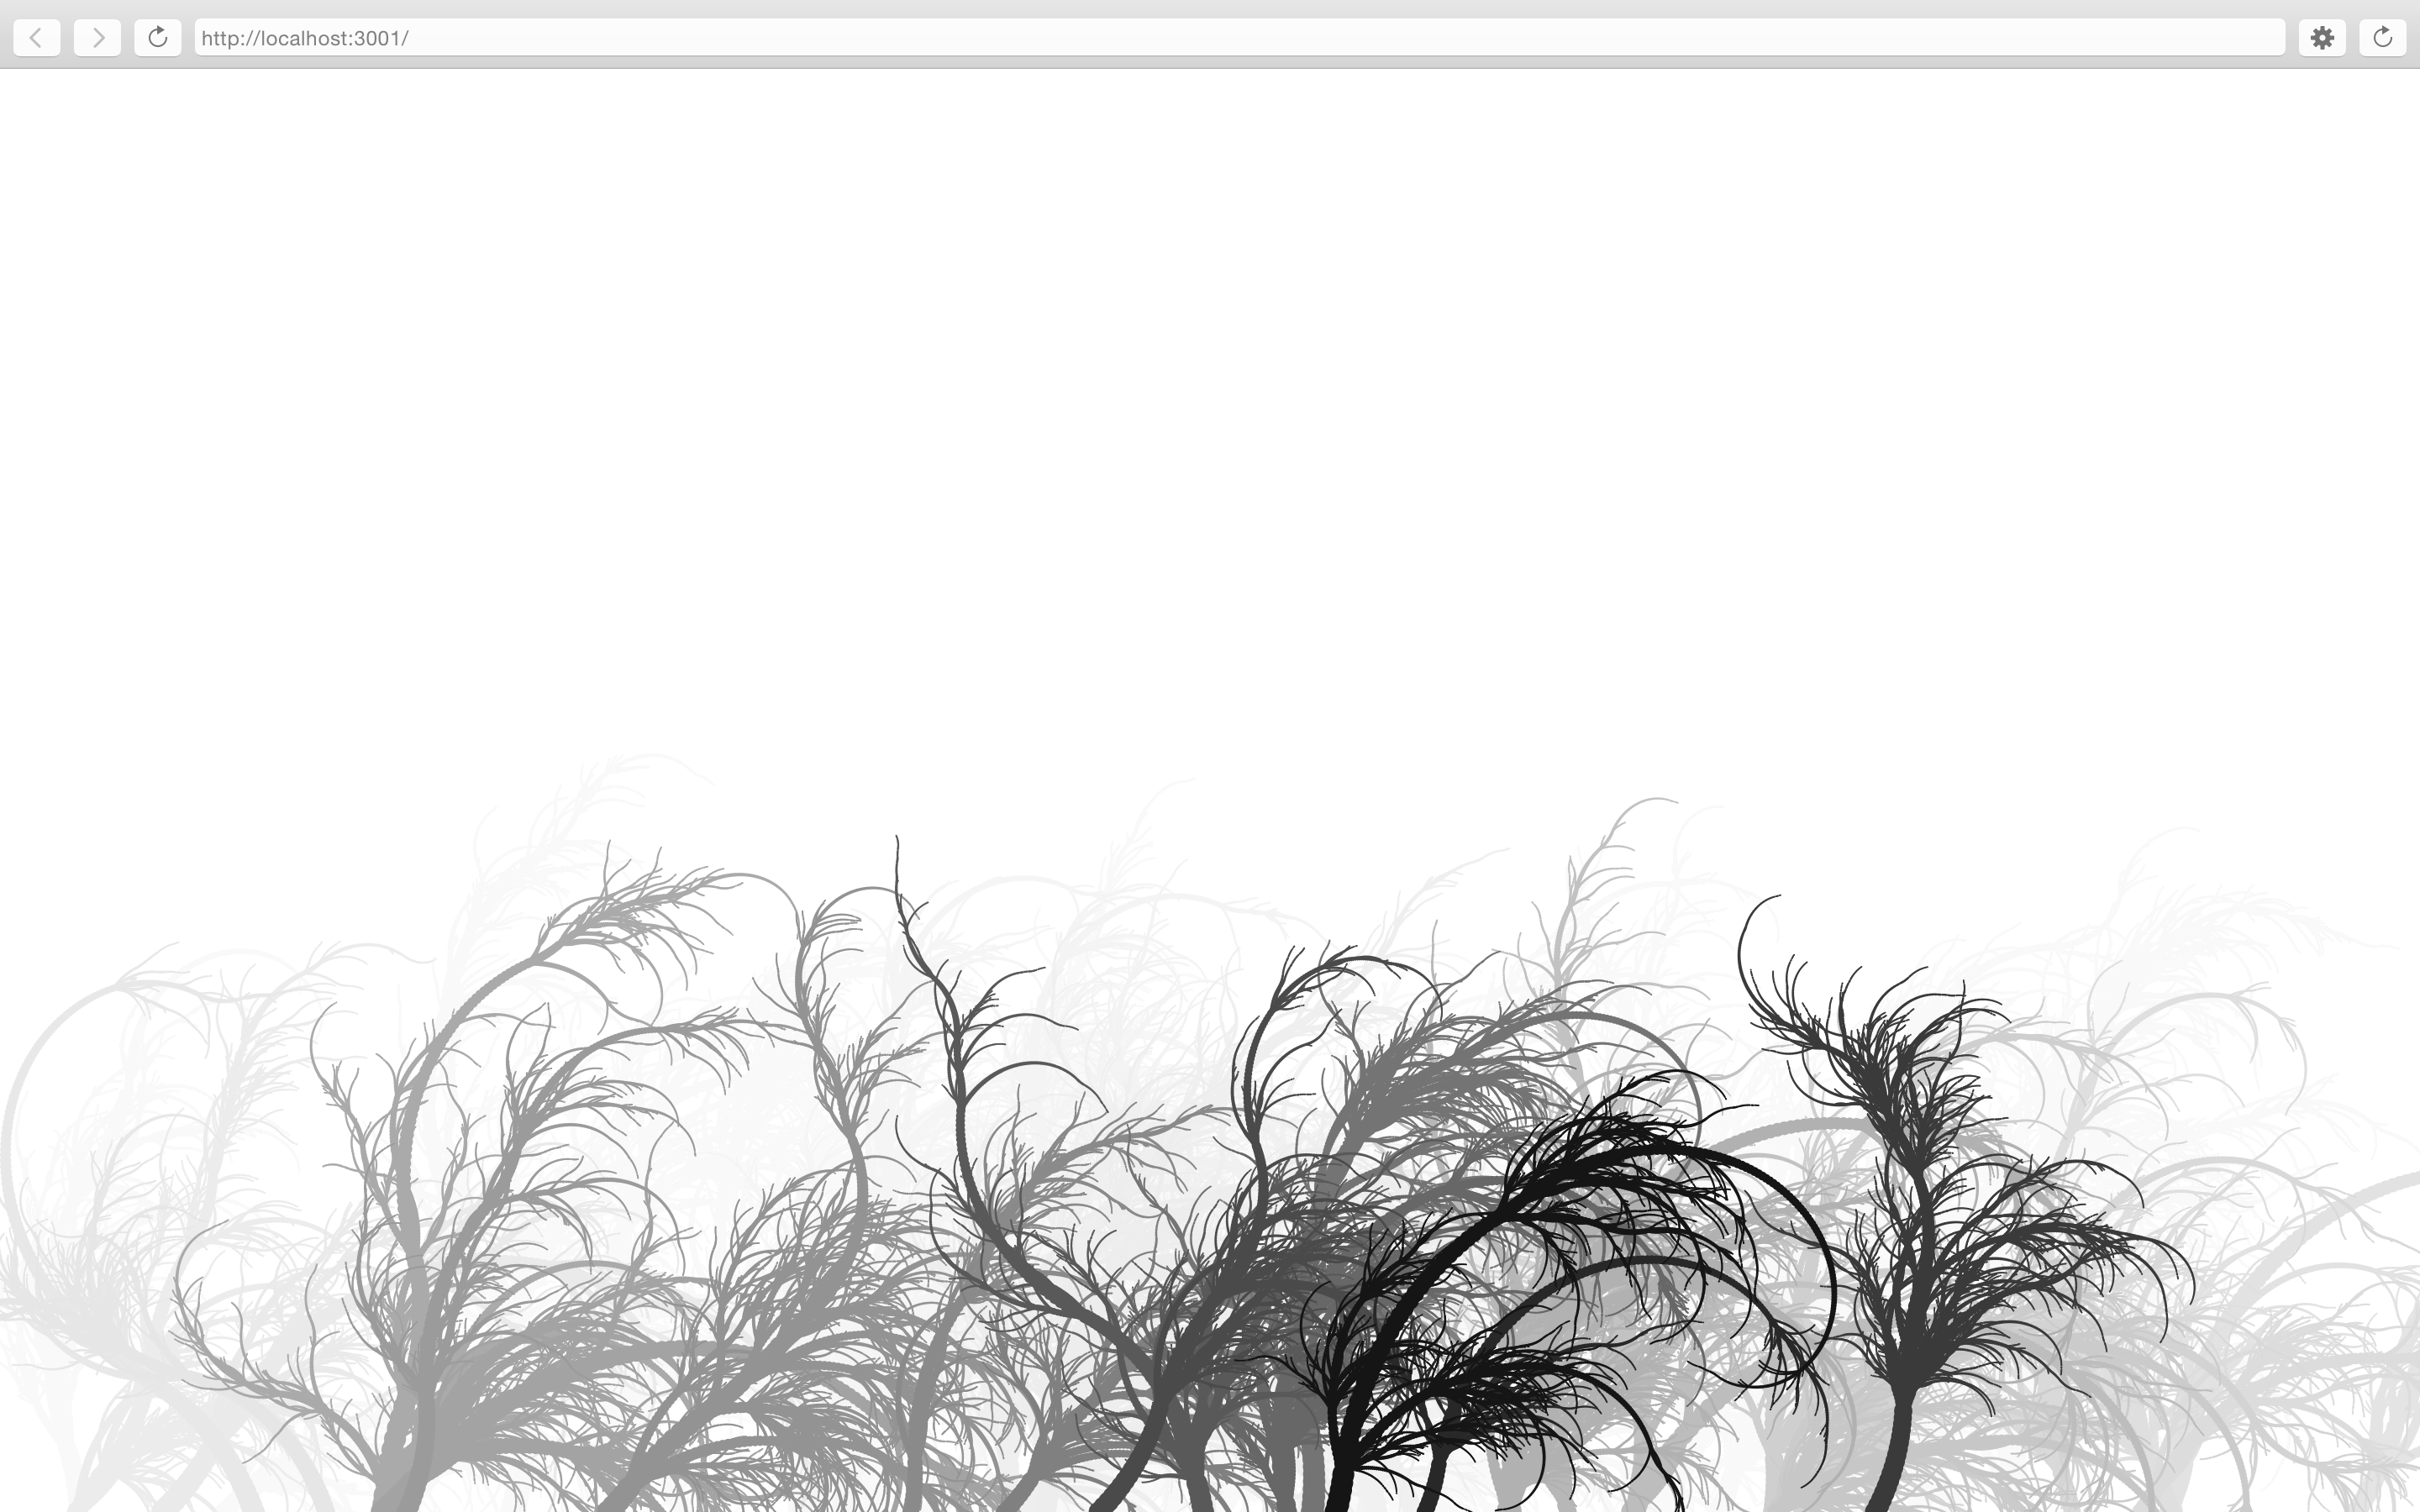
Part of my efforts to get a better grasp of what trigonometric values like cos, arc, tan, and sin produce graphically.
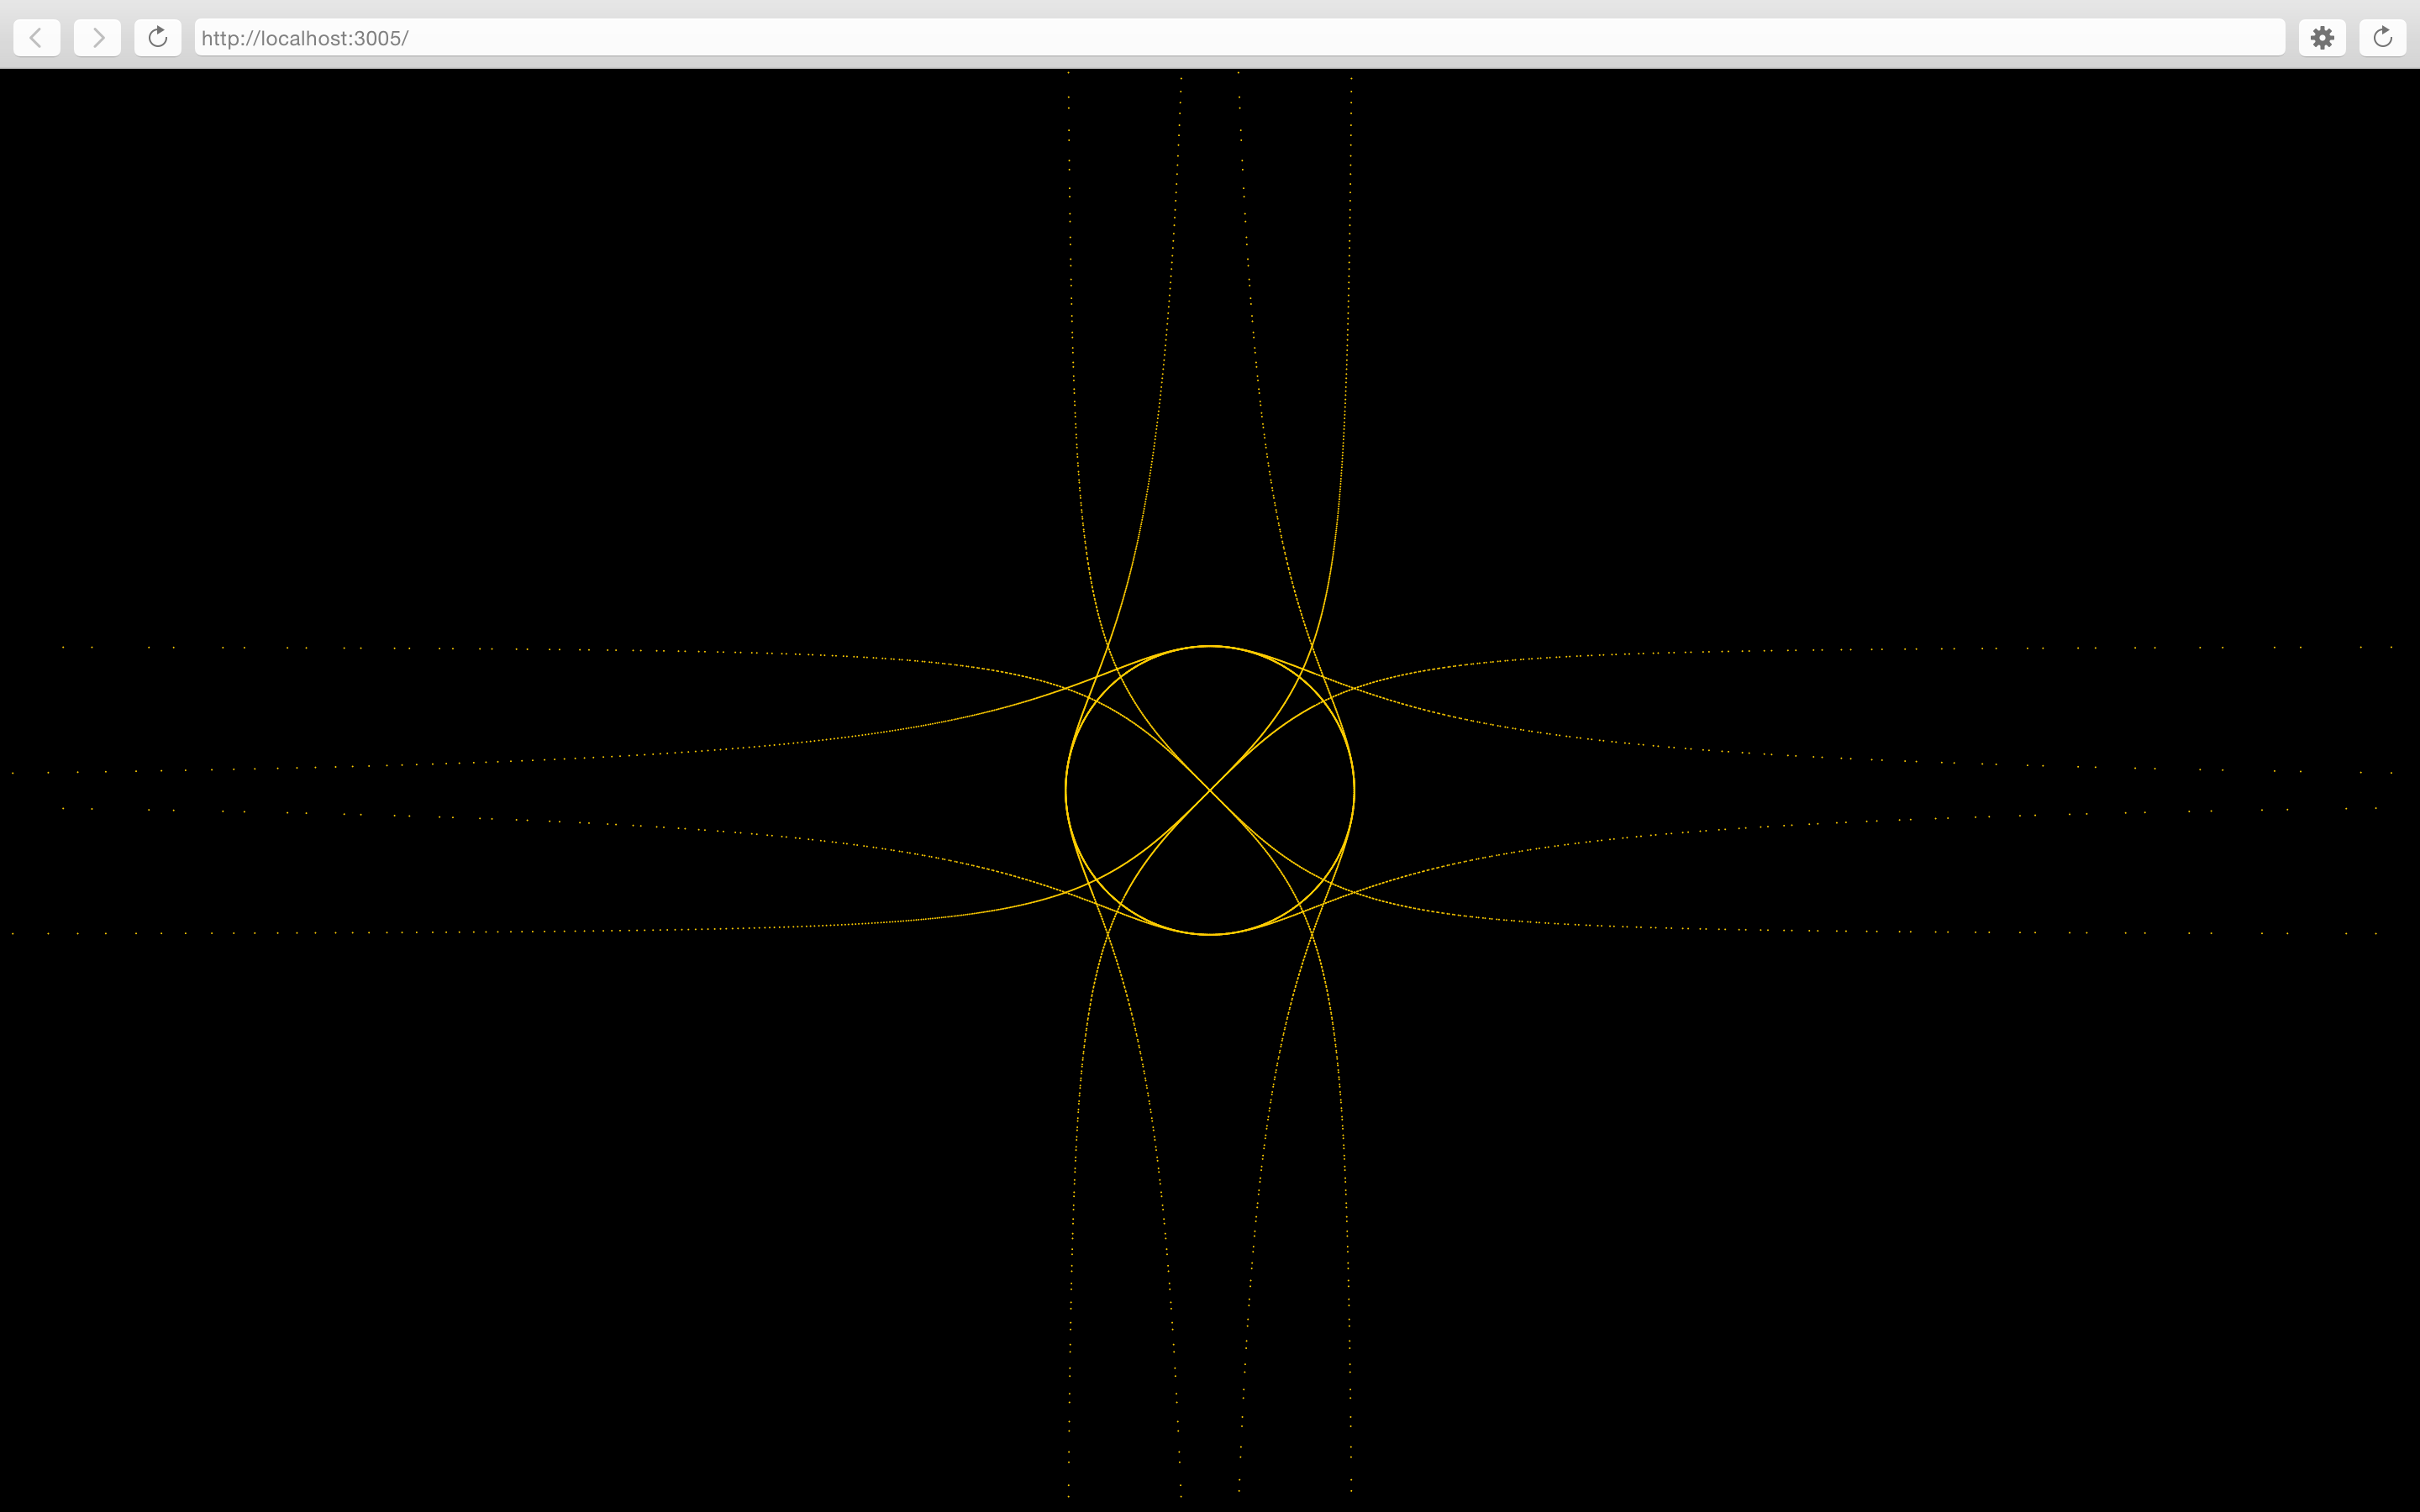
Trigonometry
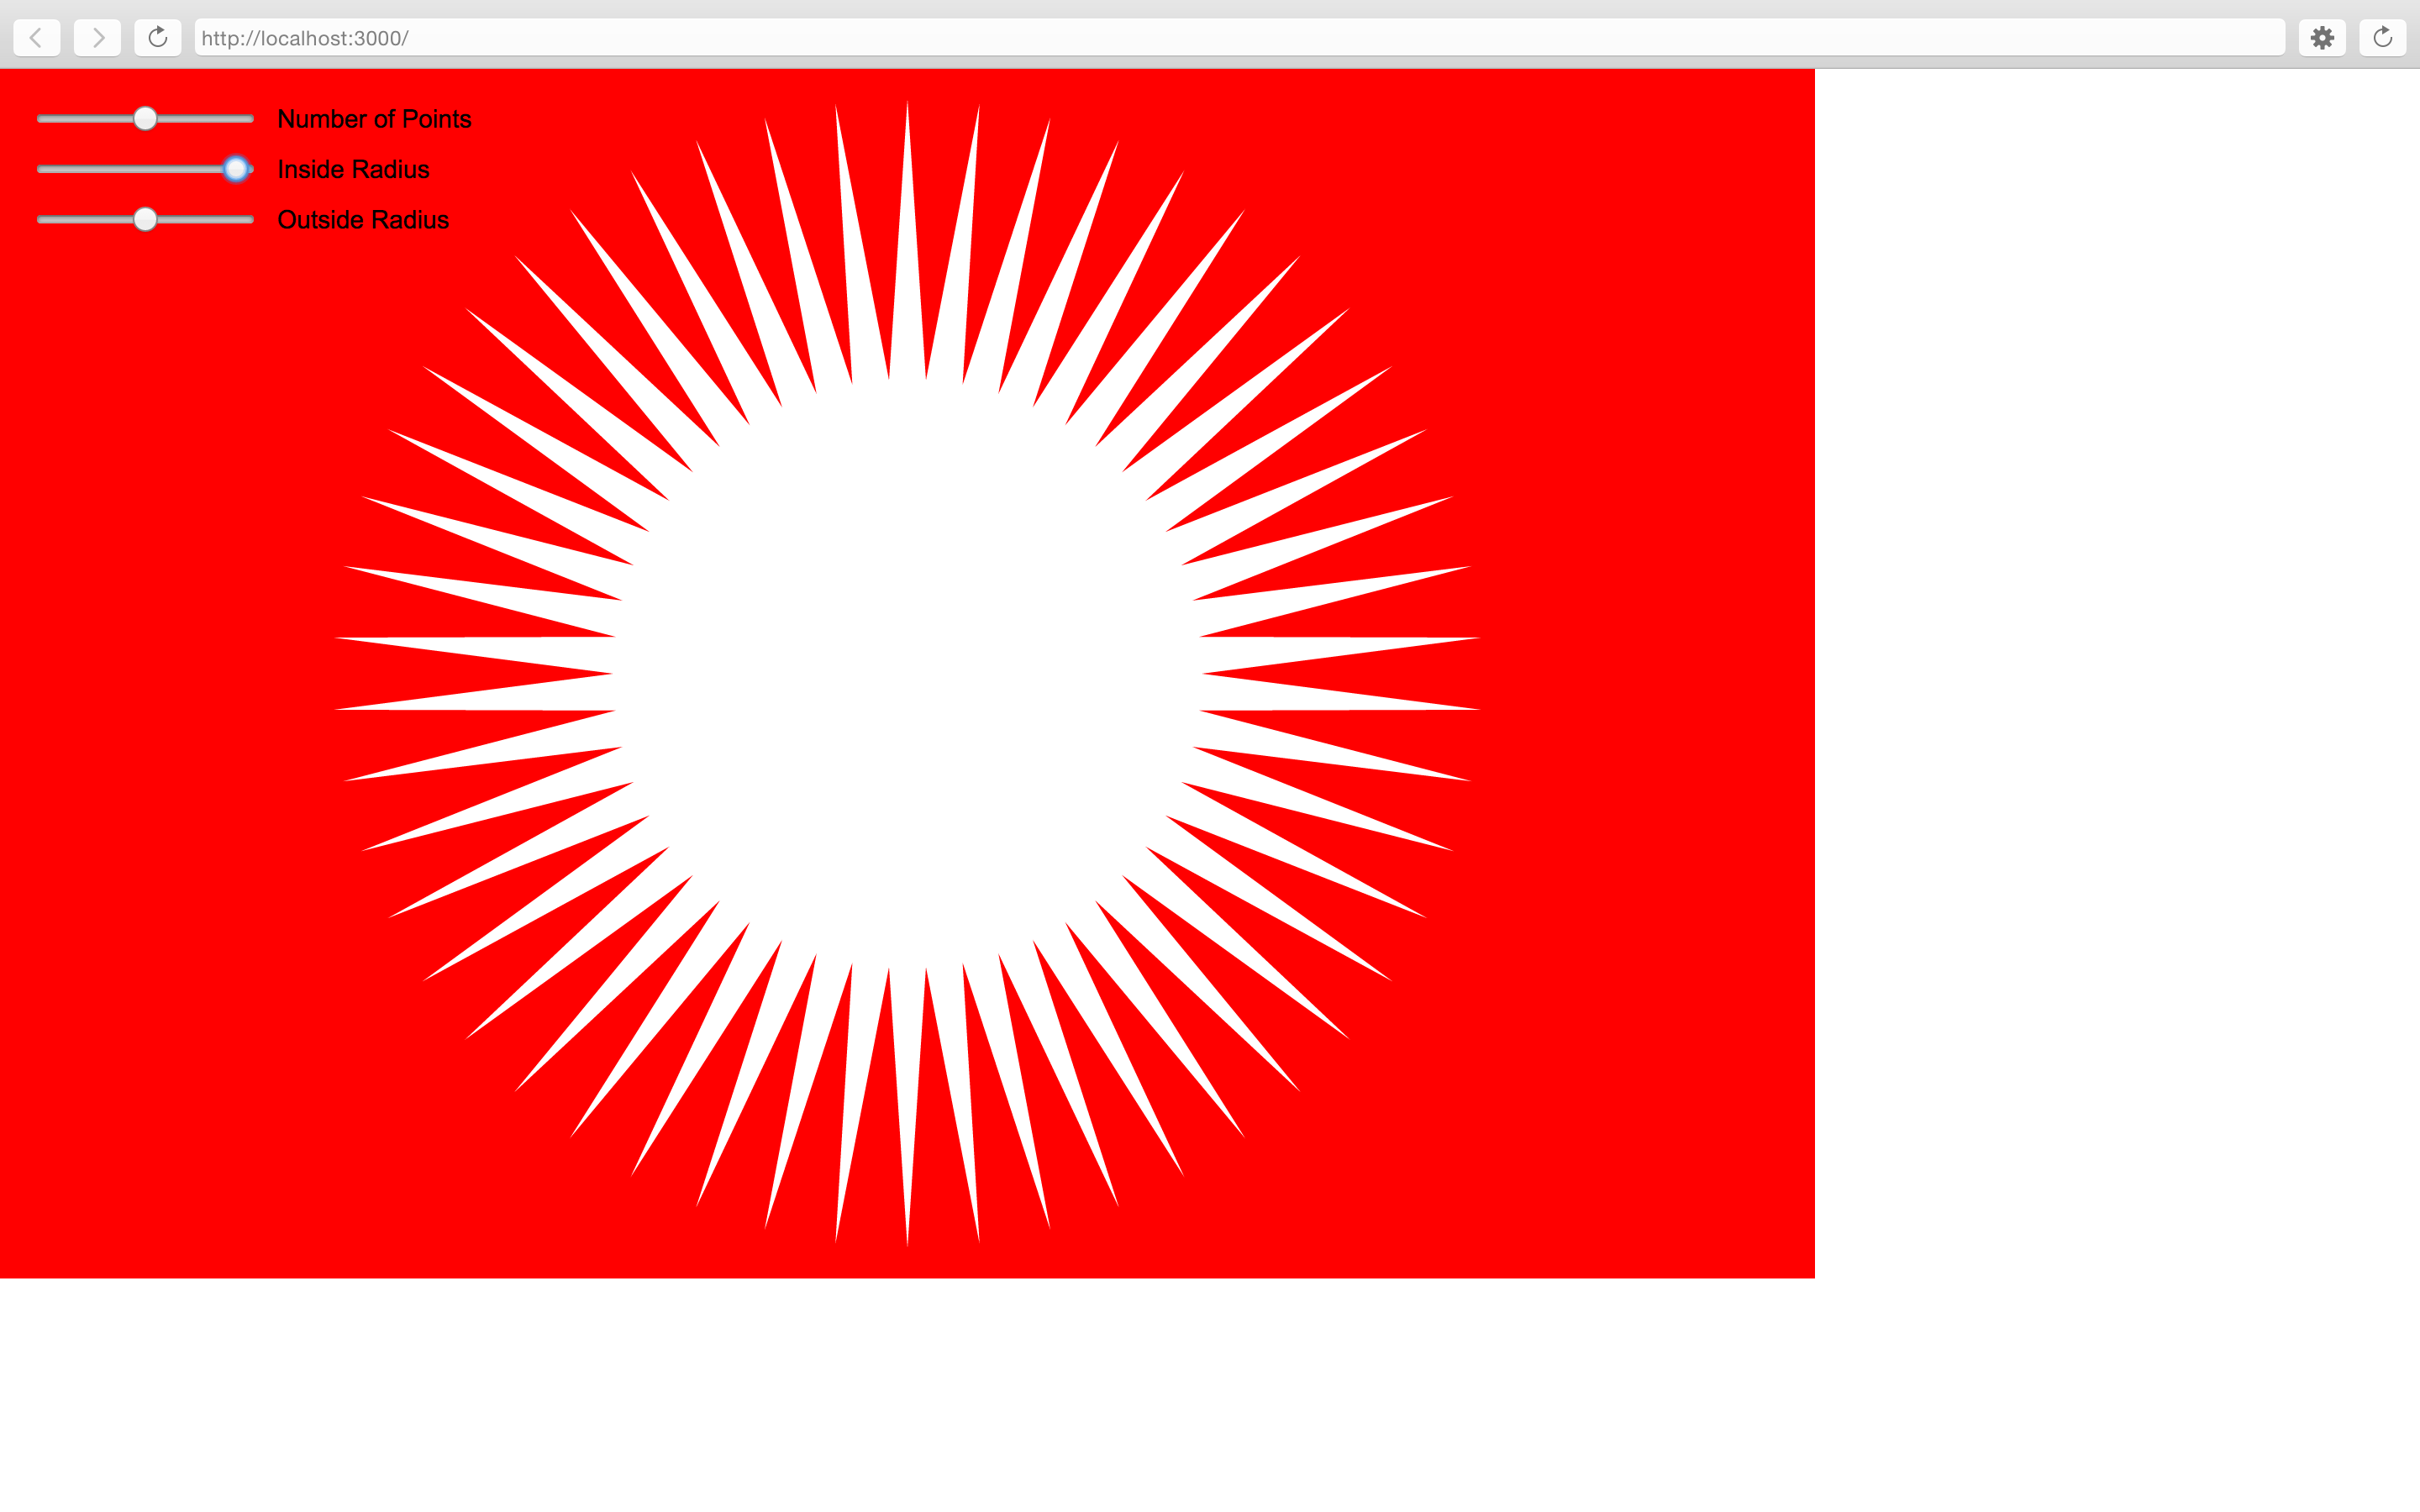
Another slider experiment.
Close on the heels of the star maker, a gear maker! Took a while to get it to work right, now if I can figure out how to make one gear turn another gear…
9/20/15
I spent a good chunk of the weekend tearing apart examples of p5 code in an effort to figure them out.
9/17/15
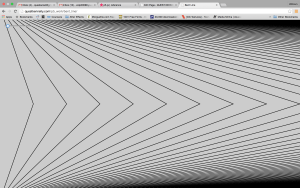
In class today we went over animation principles. The in class group exercise to produce an “opposite” animations was a very good exercise. It made us reverse engineer the activity on screen. As a group of three we produced two sets of animations, one which animated diagonal lines bottom up, and top down, as well as an interactive grow to the right, and shrink to the right on mouse movement.
Still wrapping my head around the “for loop” It’s starting to make sense, and I see it used in many higher level examples but I need more practice to get the feel for it.
9/16/15
Playing with rotation, frame rate, random, translate, etc.
9/7/15
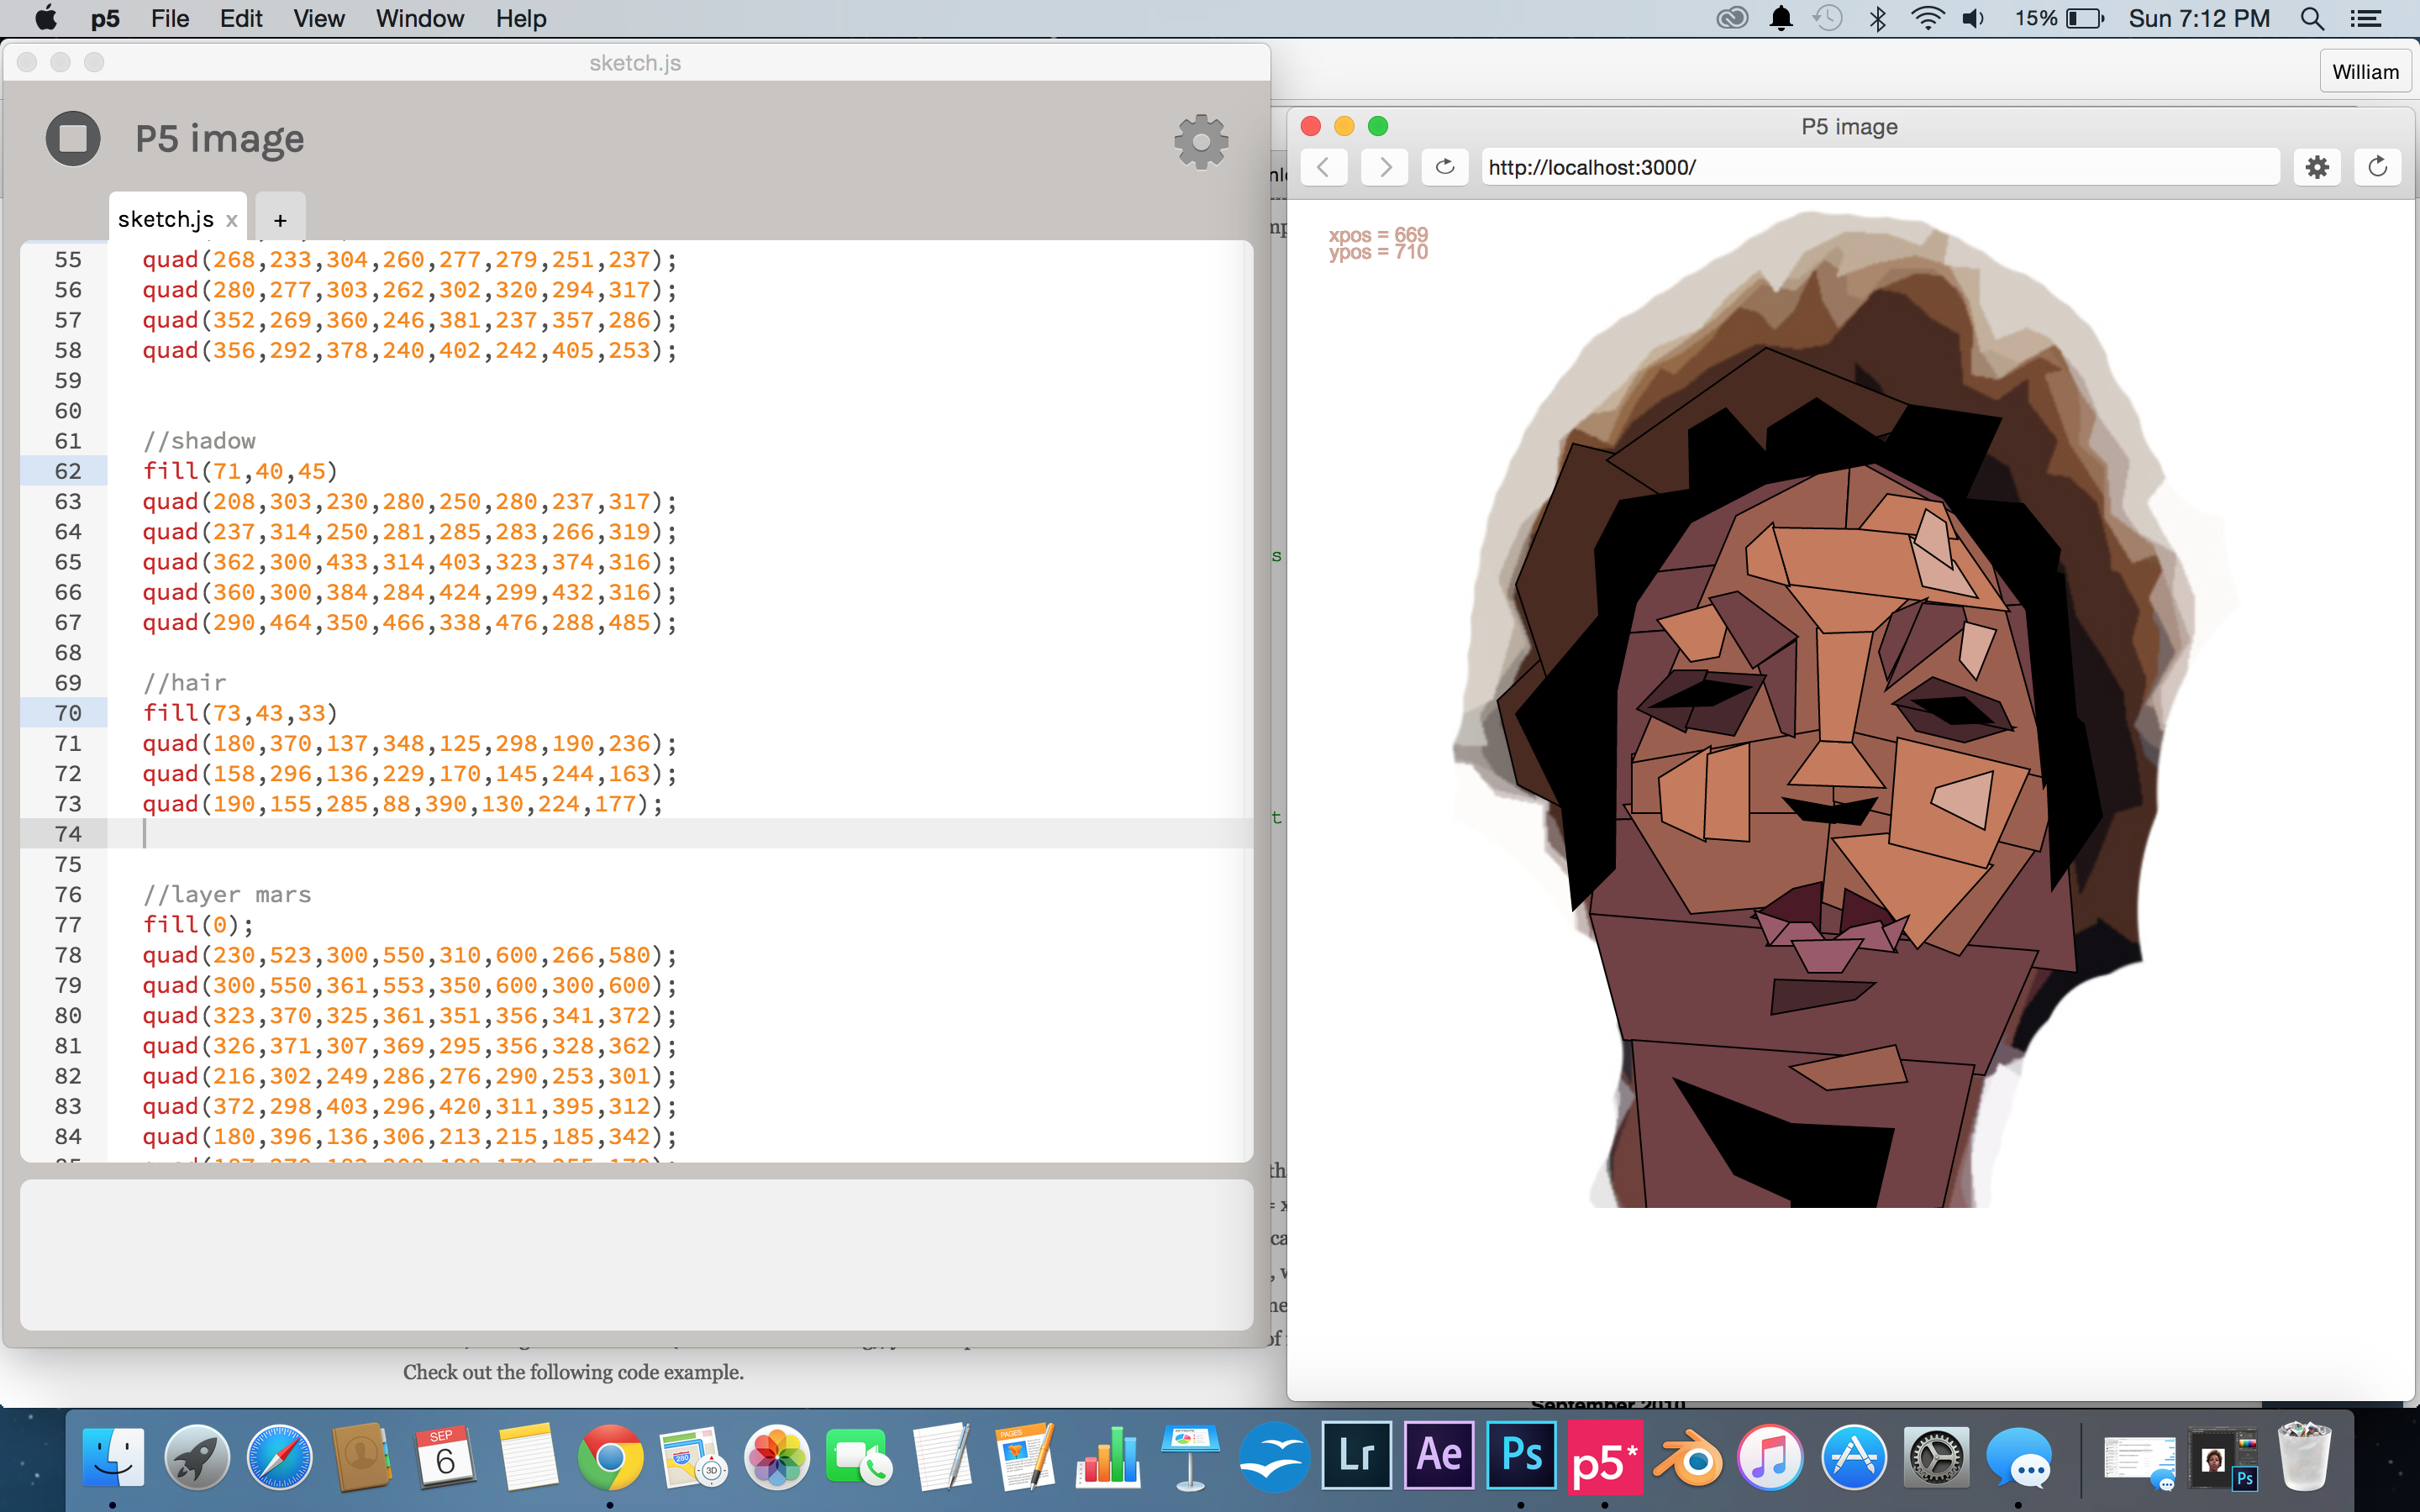
Done with the image but it just sits there on the canvas as soon as the code runs. I want to make it animate on like a time lapse of the drawing process. Found a way to make that happen with the following:
if(frameCount>30){
I removed the coordinate counter and background image.
Now the code executes the drawing in layers, the same way it was constructed.
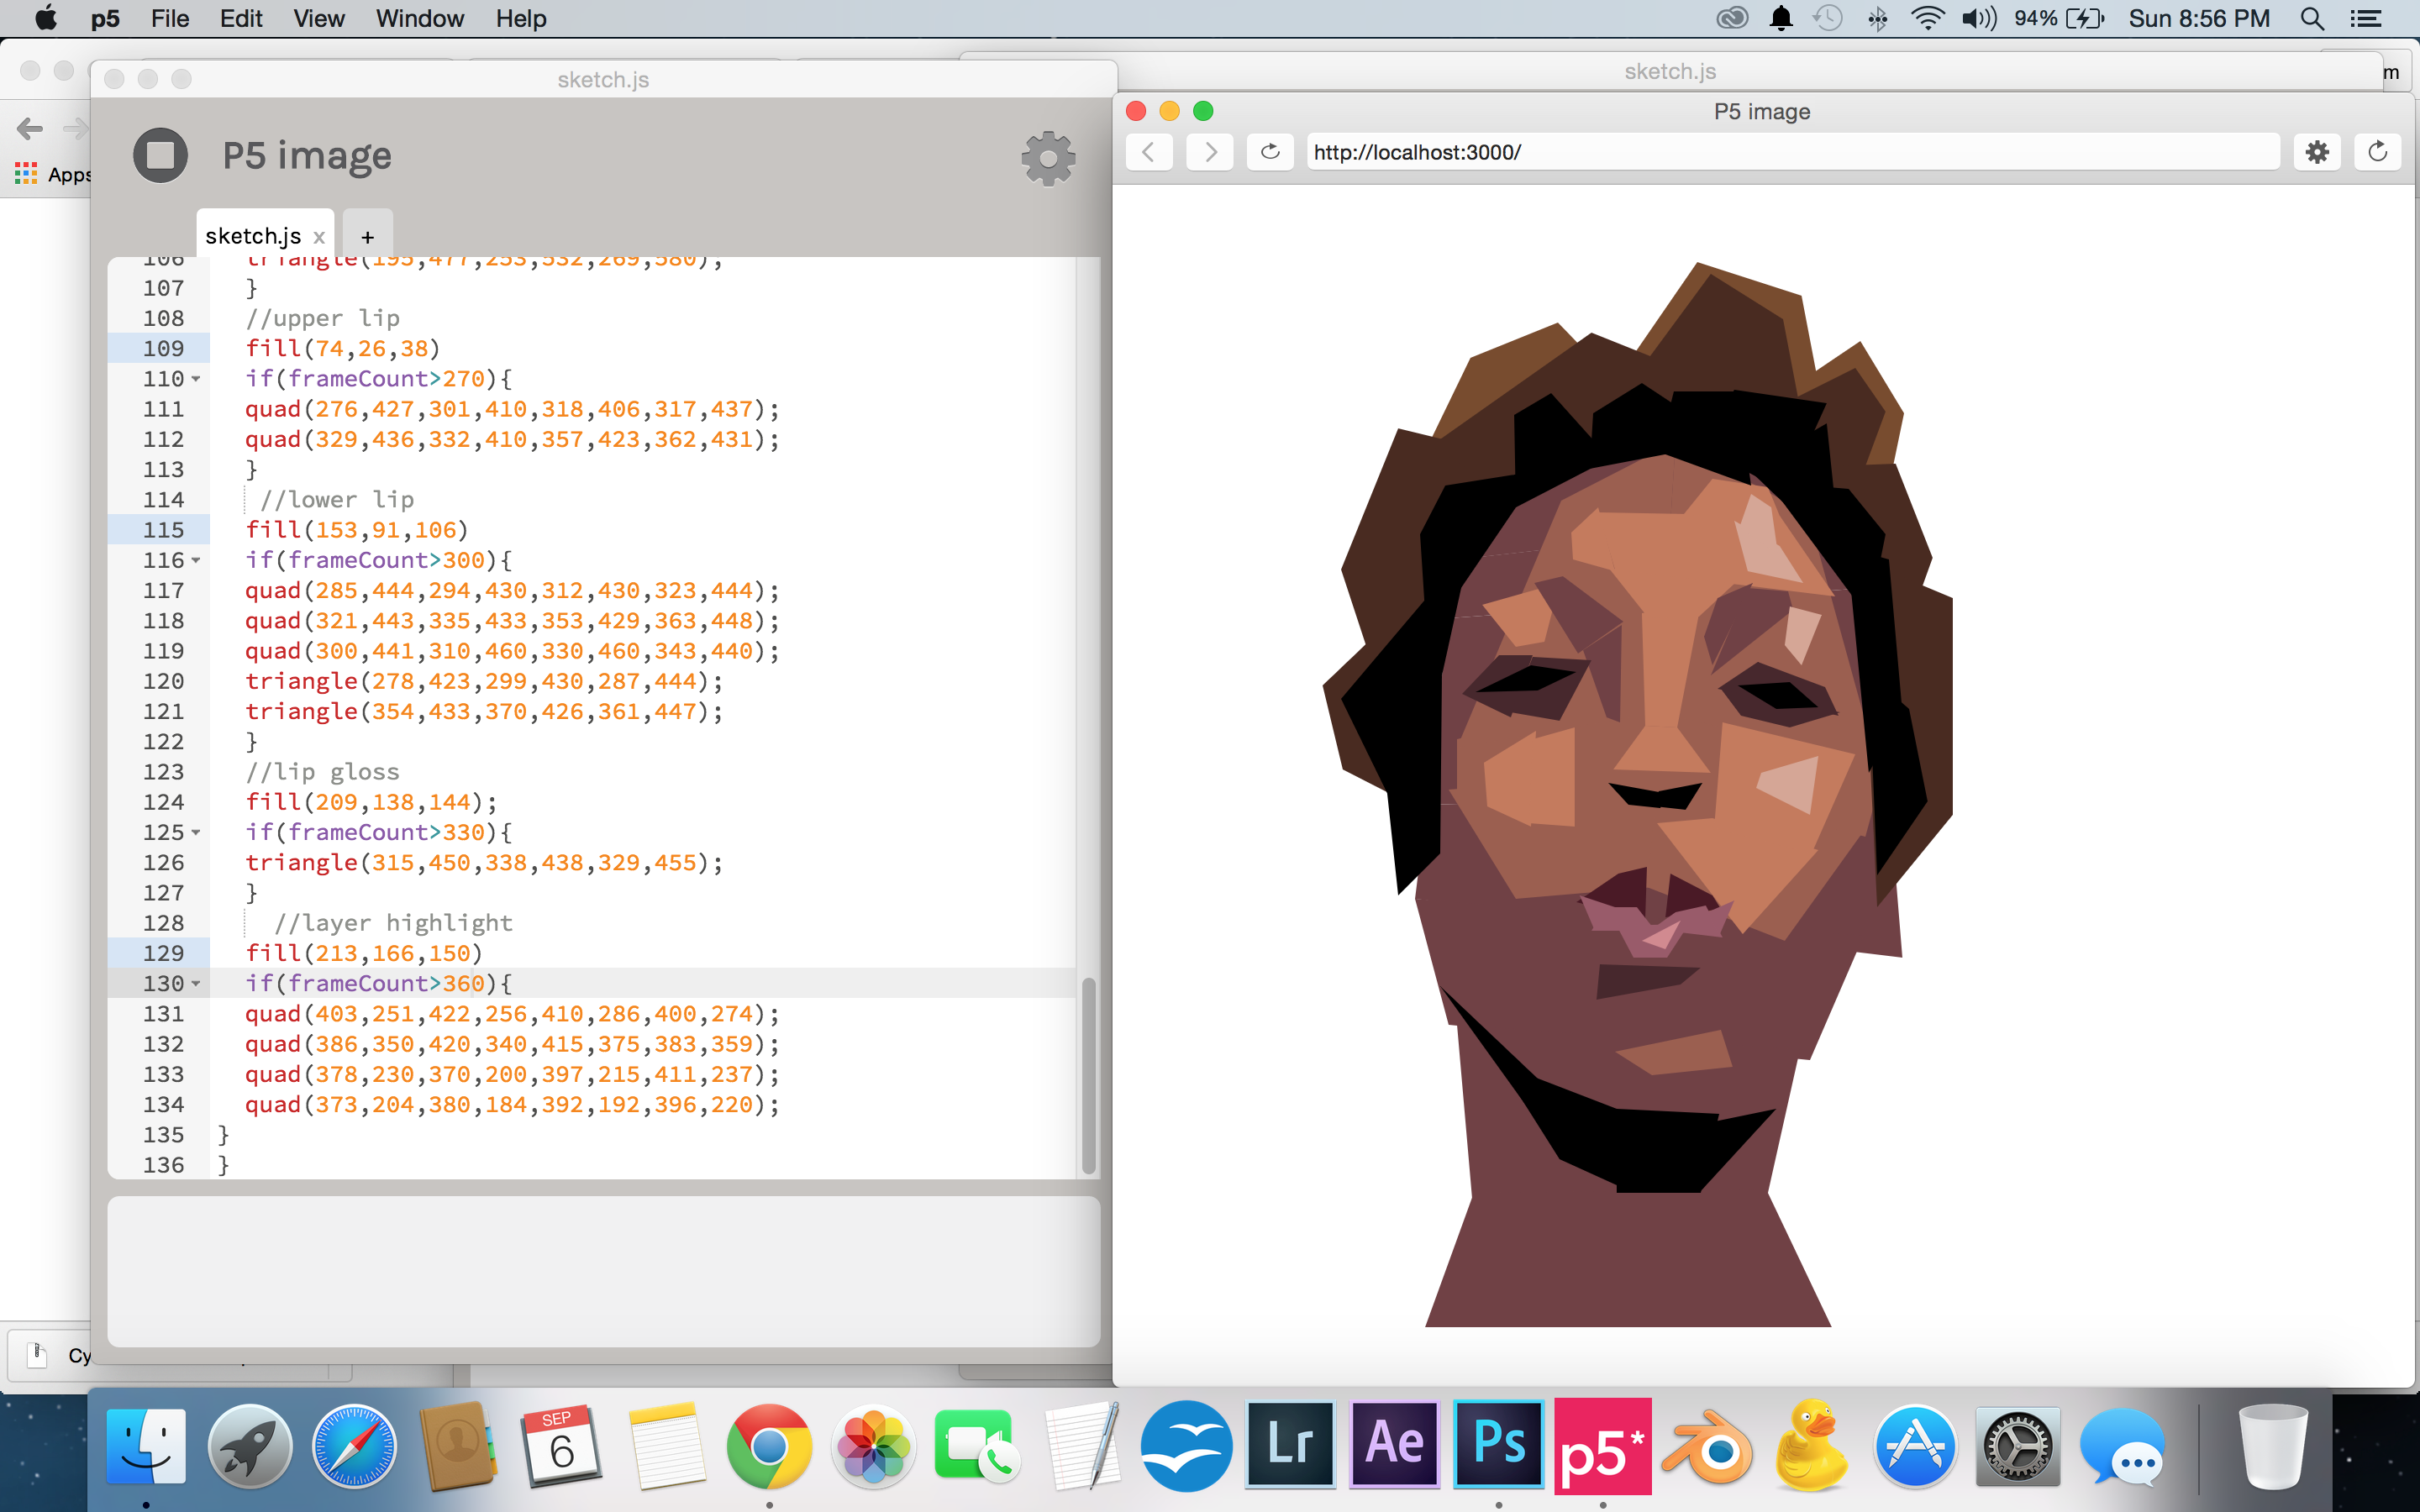
9/6/15
Entering the coordinates for all these quads is time consuming! But it’s starting to look correct. Each “layer” of shapes has the same fill color.
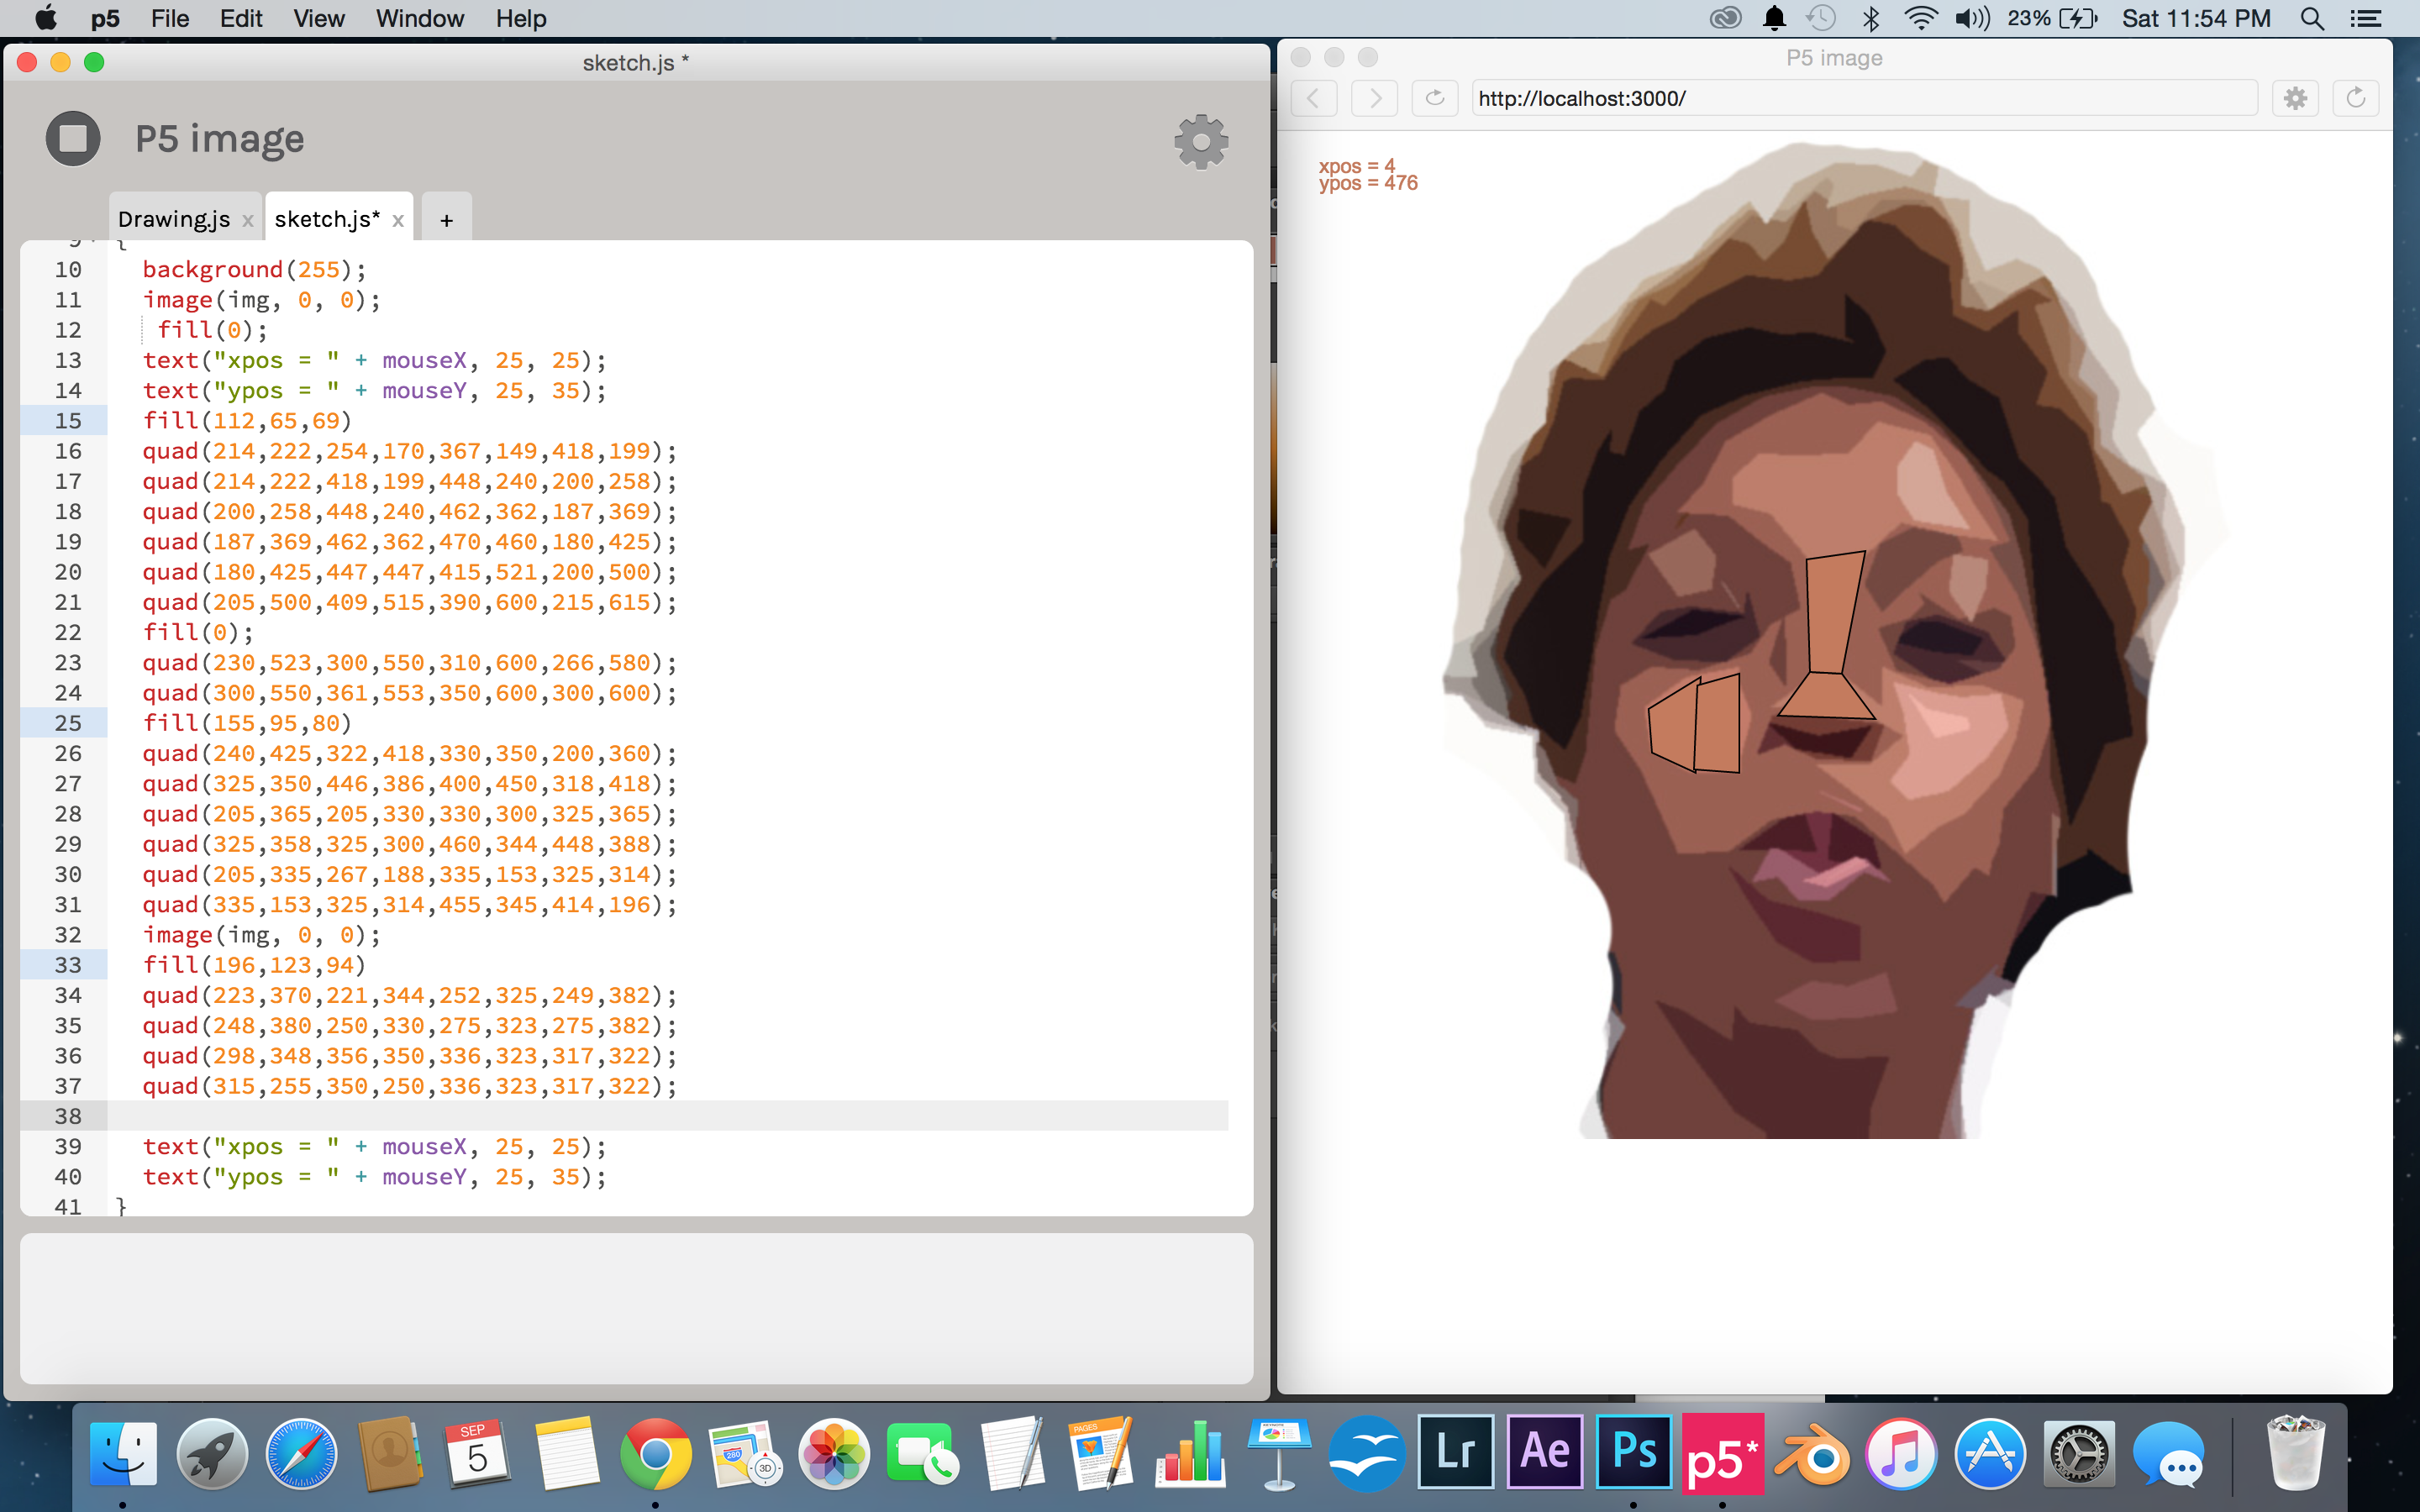
9/5/15
I decided early on that I wanted a reference to work off of. It took a while to figure out how to import an image into the background but once I got it in place I found that it was very difficult to place shapes exactly where I wanted them. After some digging around online I found a very useful line of code:
text(“xpos = ” + mouseX, 25, 25);
text(“ypos = ” + mouseY, 25, 35);
With the mouse position displayed as coordinates I was able to pinpoint the location of each shape within P5’s coordinate system.
9/3/15
Introduction to Computational Media
Instructor: Lauren McCarthy
Following instructions to create visuals. Introduction to p5.js, drawing shapes via code.
P.S. Homework: Draw your fellow classmate using only geometric primitives created in p5.js.